
The R-squared (or r2) is a measure that represents how much variation of a dependent variable is explained by the independent variable. The higher the value of r-squared, the more of one variable’s variance is explained by the variance of another. In this tutorial, you’ll learn how to use Excel to calculate the r-squared value.
By the end of this tutorial, you’ll have learned the following:
- What the r-squared value represents
- How to calculate the r-squared value in Excel
- How to interpret the r-squared value of a dataset
Understanding the r-squared Value
The correlation of a dataset explains the strength of the relationship between two variables. Meanwhile, r-squared represents how much of the variance of the dependent variable is explained by the variance of the independent variable.
The r-squared value ranges from 0-1. Let’s break down how to interpret the value:
- If r2 is equal to 0, then the dependent variable cannot be explained by the independent variable
- If r2 is equal to 1, then the dependent variable can be completely explained by the independent variable
- The higher the value for r2, the more explained the variance of the dependent variable is explained by the independent variable
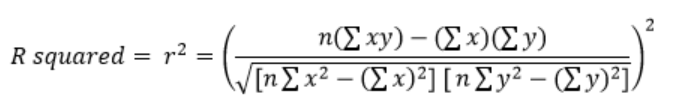
Mathematically, the formula for r2 is written as:
Thankfully, Excel makes it much easier to calculate the value for r2 using the RSQ() function. If you’re curious about the function, Excel makes calculating a square root very simple. Similarly, squaring a number is made easy in Excel, as well!
How to Calculate r-squared in Excel
In order to calculate the r-squared, or r2, value in Excel you can use the RSQ() function. The function allows you to pass in a set of known dependent and independent values. The function then completes the complex equation above and returns a single value. Let’s take a look at how the function is written:
=RSQ(known_y's,known_x's)We can see that the function requires two arguments:
known_y'srefers to an array or range of data points, representing the dependent variableknown_x'srefers to an array or range of data points, representing the independent variable
At this point, you may be wondering how to use the function.
How can you calculate the r-squared value in Excel?
To calculate the r-squared value in Excel, you can use the RSQ() function. The function accepts a range or array of values representing the known dependent values and the known independent values. The function then returns a single value between 0 and 1, representing the r-squared value.
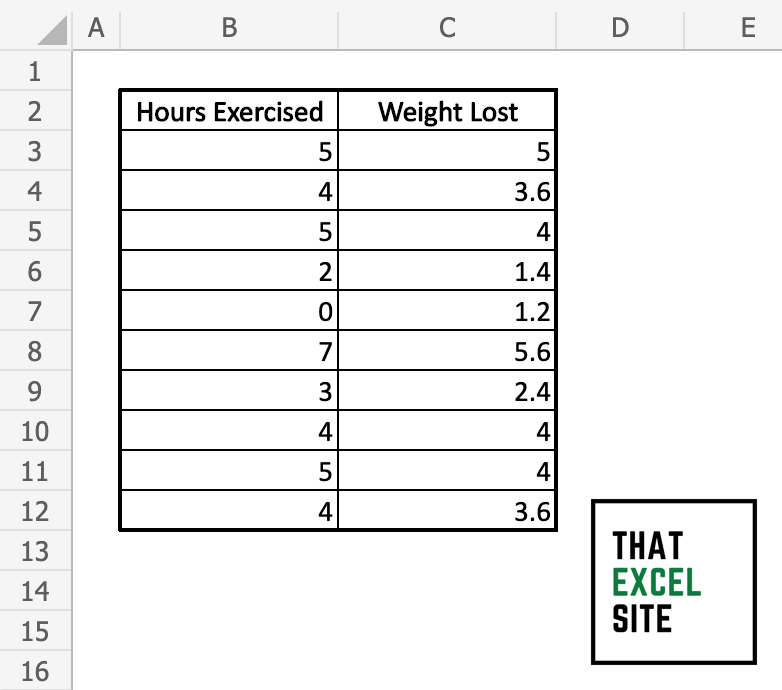
Let’s now take a look at an example. Imagine that we have a set of data containing two columns of data:
- The number of hours exercised, and
- The amount of weight lost.
We can say that the number of hours exercised is our independent (x) variable. We want to determine the measure of the effect that the amount of exercise a person does has on the amount of weight lost. In this case, then, the Weight Lost variable is our dependent (y) variable.
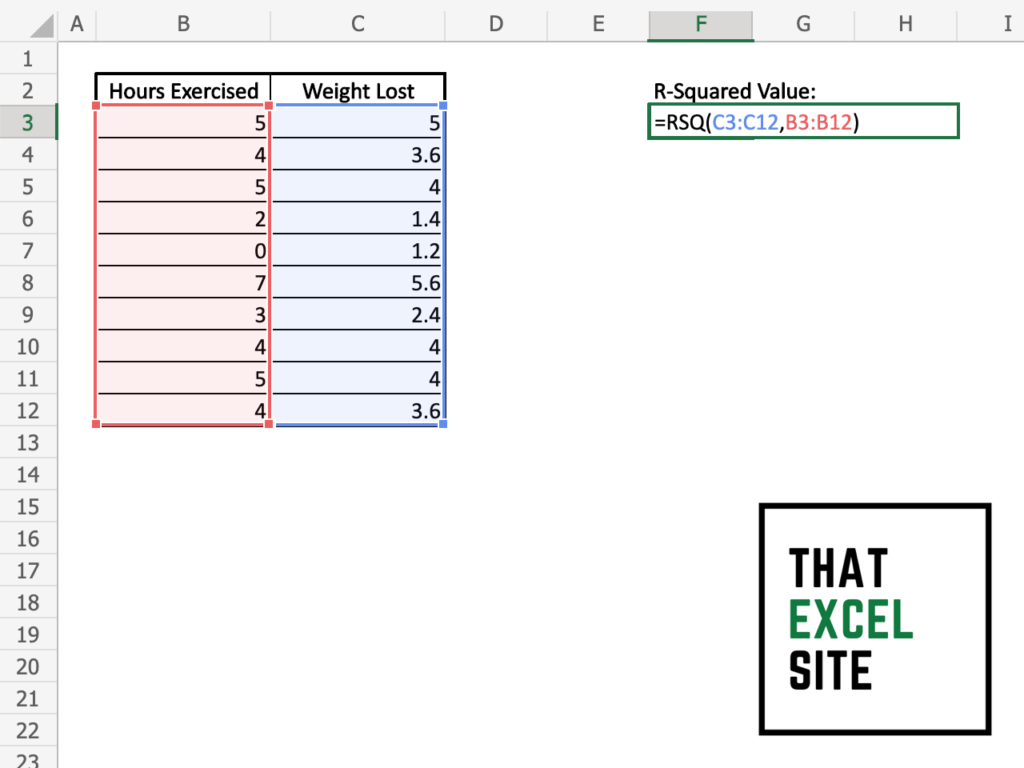
We can then write our RSQ() function into one of the adjacent cells. Remember, the RSQ() function is expecting that we include our known x values and our known y values. Because of this, we use the following formula:
=RSQ(C3:C12,B3:B12)Let’s take a look at what this looks like in Excel:
Once we hit the Return key, we can see that the value has been filled in. In this case, we have an r-squared value of 0.898. This indicates that the number of hours exercised has a strong influence on the amount of weight lost.
Let’s take a look at the final result in Excel:
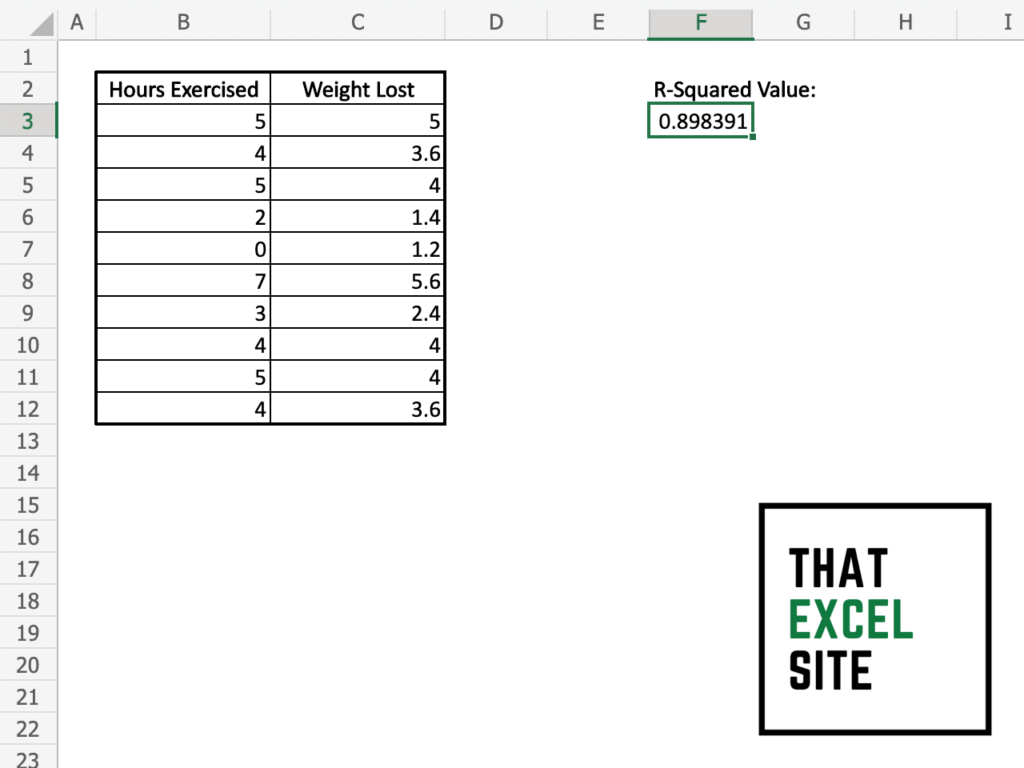
In the image above, the formula used is included for your reference. We can see that while the original formula for the r-squared value may have been intimidating, Excel makes easy work of calculating this for you!
Additional Resources
To learn more about related topics, check out the tutorials below: