The coefficient of variation (CV) is a measure of how spread out values in a dataset are relative to the average value. It’s a common calculation that, unfortunately, doesn’t have a built-in function in Excel. Thankfully, this post will simplify that for you! By reading this tutorial, you’ll learn how to calculate the coefficient of variation in Excel.
By the end of this tutorial, you’ll have learned the following:
- How to calculate the coefficient of variation in Excel using built-in formulas
- How to calculate the coefficient of variation for multiple columns
- How to interpret the coefficient of variation for multiple datasets
Understanding the Coefficient of Variation
What is the coefficient of variation?
The coefficient of variation (CV) is a measure of how spread out values are relative to the mean of the data. The CV allows you to easily compare the variation between two datasets.
You can calculate the coefficient of variation using the following formula:
CV = σ / μWhere σ is the standard deviation of the dataset and μ is the mean of the dataset.
The coefficient of variation is used to compare the variation between two or more datasets, relative to their mean. When we calculate the coefficient, we actually remove the units from the value. This can be helpful in comparing two different types of data. Similarly, the value is often represented as a percentage, which makes it very easy to understand.
How to Calculate the Coefficient of Variation in Excel
While Excel doesn’t offer a built-in way of calculating the coefficient of variation, Excel provides helpful functions that support calculating the CV. Recall that to calculate the coefficient of variation, you need the standard deviation and the mean of the dataset.
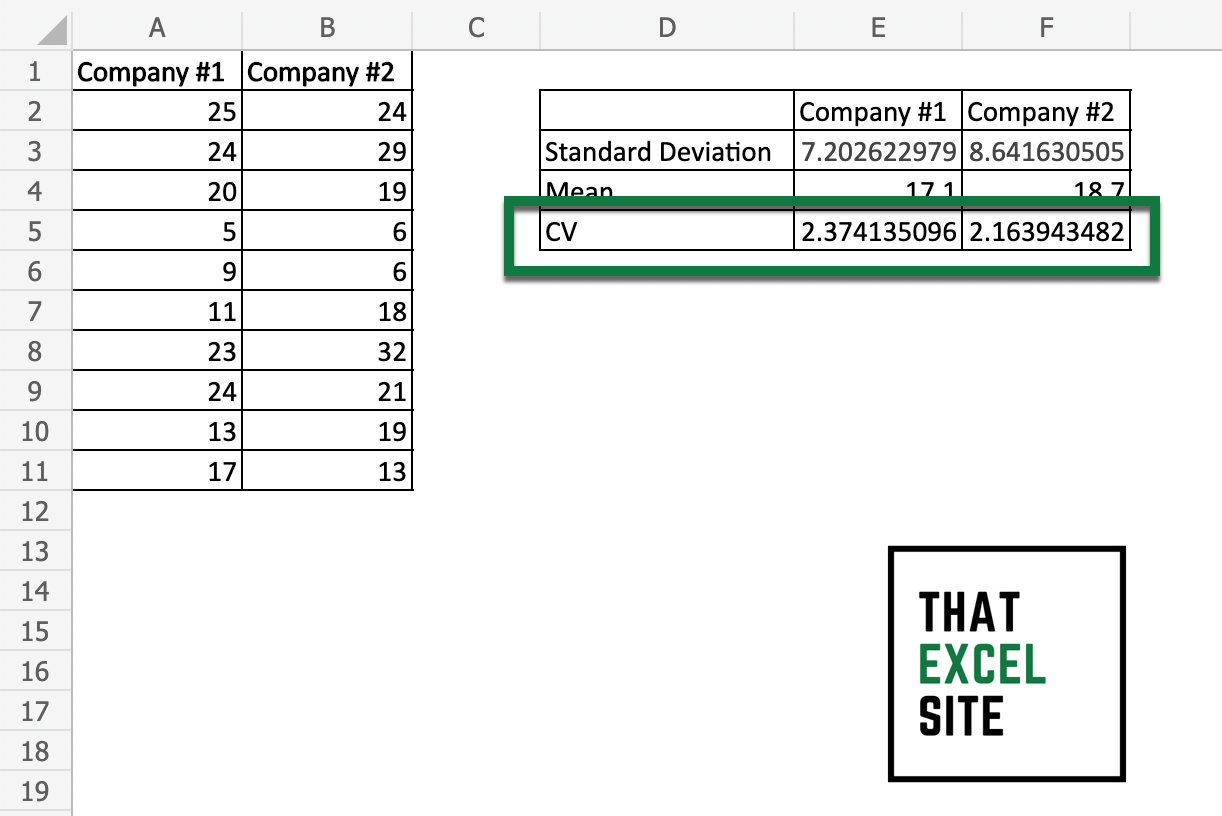
Let’s take a look at our final output, where we calculate the standard deviation, mean, and coefficient of variation for two datasets:

Calculating the coefficient of variation in Excel is easy using formulas for standard deviation and average.
Load your dataset in Excel

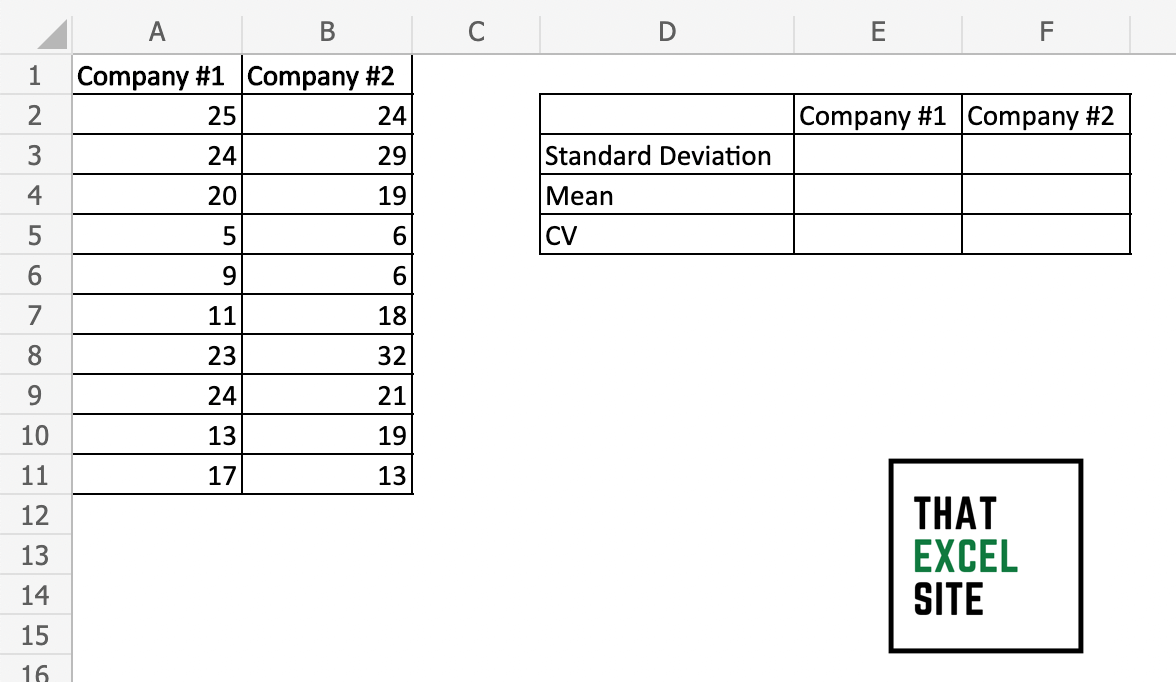
Let’s start by loading the dataset in Excel. Our data contains 2 columns of data, representing returns from different investments. We also have placeholders for calculating standard deviations, averages, and coefficients of variation.
Calculate the Standard Deviation and Mean

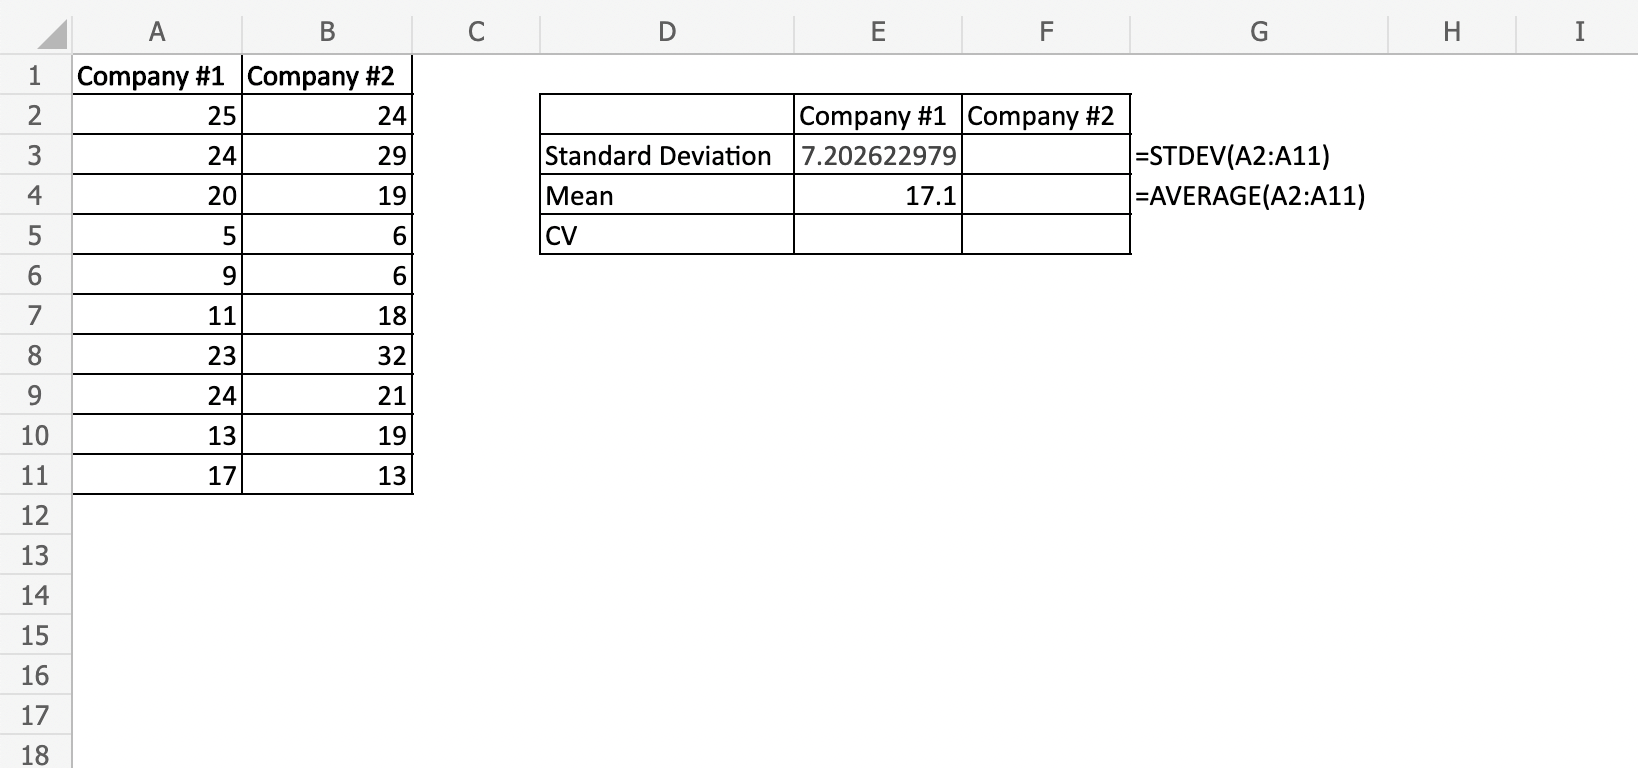
In order to calculate the standard deviation of our data, we’ll use the STDEV() function and the AVERAGE() function to calculate the average of our dataset.
In this case, we’ll use the following formulas:
mean = AVERAGE(A2:A11)
standard deviation = STDEV(A2:121)
Divide the Standard Deviation by the Mean

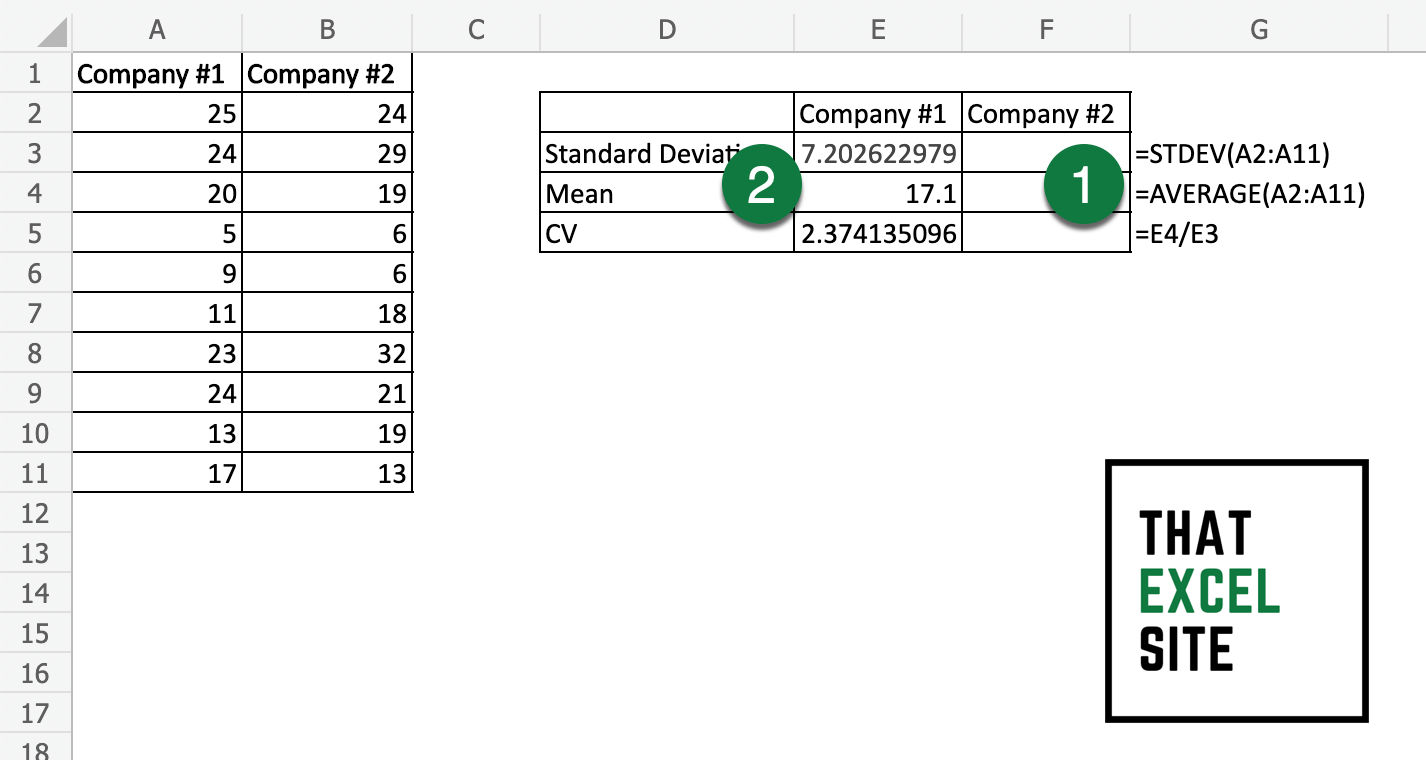
To calculate the coefficient of variation, simply divide the standard deviation by the average value. In order to do this, we can simply use the / operator in Excel.
Repeat the Process for the Other Dataset

Calculate the coefficient of variation for your other data column. Once calculated, you can compare the coefficients of variation for the two columns.
In the steps above, you learned how to calculate the coefficient of variation for two datasets. Now, let’s dive into how to interpret the value.
How to Interpret the Coefficient of Variation
The coefficient of variation is the ratio of the standard deviation compared to the average value. Because of this, the higher the coefficient of variation, the greater the variation from the average value. Inversely, the smaller the coefficient of variation, the closer values are clustered to the mean.
In most cases, the coefficient of variation is expressed as a percentage. This allows you to remove units from the calculation, allowing you to compare distributions of values where the scales are not comparable.
When Not to use the Coefficient of Variation
There are a number of guidelines in terms of when not to use the coefficient of variation. The first is that you should not use the CV when you’re working with interval data. For example, if you’re looking at temperatures in Celsius, Fahrenheit, or Kelvin. Because the scales don’t have an absolute zero, they will give you strange, less meaningful results.
Similarly, be cautious when your mean is close or equal to zero. Because dividing by zero will return infinity (or in Excel’s case, an error), the CV will be extremely large. Because of this, even small variances will have their effects amplified.
Conclusion
In this tutorial, you learned how to calculate the coefficient of variation in Excel. The coefficient of variation represents how spread out values in a dataset are relative to the mean. While Excel doesn’t provide a built-in way of calculating the CV. Using the functions for standard deviation and the average makes calculating the CV easy work.
You then learned how to calculate the coefficient of variation for two columns. From there, you learned how to interpret the CV value. You learned that the CV represents the ration of the standard deviation compared to the average value. Because of this, the smaller the coefficient of variation, the more closely clustered values will be to the mean.
Additional Resources
To learn more about related topics, check out the tutorials below:

