
By the end of this tutorial, you’ll have learned:
- What a z-score is and why it matters
- How to calculate the z-score in Excel for a single value
- How to calculate the z-score in Excel for an entire column
- How to interpret z-scores in Excel
What are Z-Scores and Why Do They Matter?
A z-score is a statistical measure that tells you how many standard deviations a particular value is from the average value of the whole dataset. A standard deviation represents the spread of your data as it relates to the mean of your data.
Because of this, a z-score can tell you varied that the data point is relative to the dataset itself.
The formula for a z-score is: z = (X – μ) / σ
where:
- X is our data point
- μ is the mean (or average value) of the dataset
- σ is the standard deviation
Now that you have a good sense of how to calculate a z-score, let’s dive into how to do this in Excel!
How to Calculate a Z-Score in Excel
While Excel doesn’t provide a built-in function to calculate a z-score, we can easily use functions for calculating standard deviations and calculating average values.
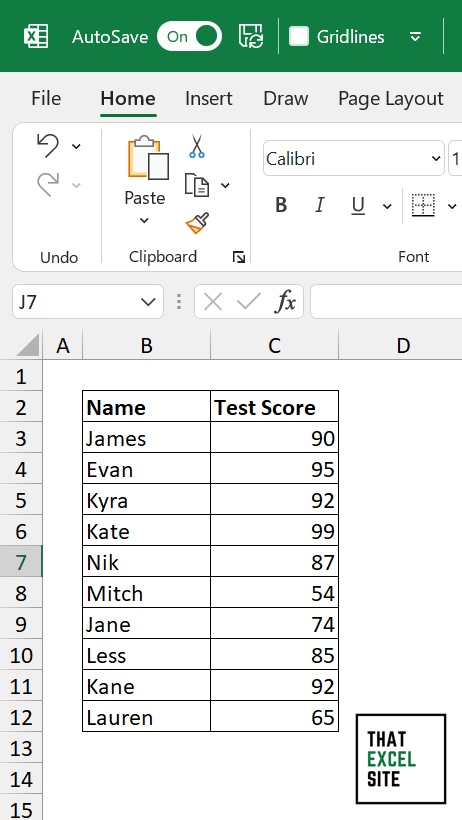
To follow along, let’s load our sample dataset. We have a number of student test scores, representing scores on the latest test:
We can calculate the average value and the standard deviation for our dataset using the AVERAGE() and STDEV.P() functions. Since we’re working with population data, we can use the P variant of the function.
Now that we know what the standard deviation and average value of our dataset are, we can calculate the z-score. In order to do this for a single data point, we can simply subtract the average from the data point and divide this number by the standard deviation.
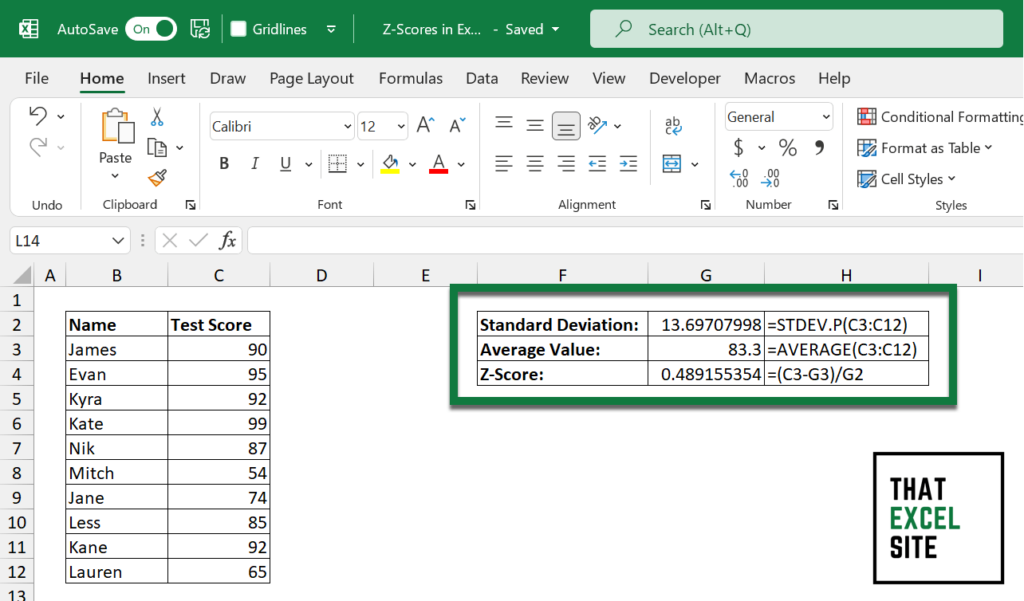
When we calculate the z-score for James, we can see that we get a z-score of 0.489. We can see that because the z-score is roughly 0.5, that it’s less than half a standard deviation away from the mean value.
In the following section, you’ll learn how to calculate a z-score for an entire column in Excel.
How Can You Calculate a Z-Score in Excel for an Entire Column
Excel makes it easy to calculate a z-score for an entire column. We can simply replicate the process above using absolute references. That way, when we copy the formula down for an entire column, the references will be in tact.
Let’s see what our formula will look like:
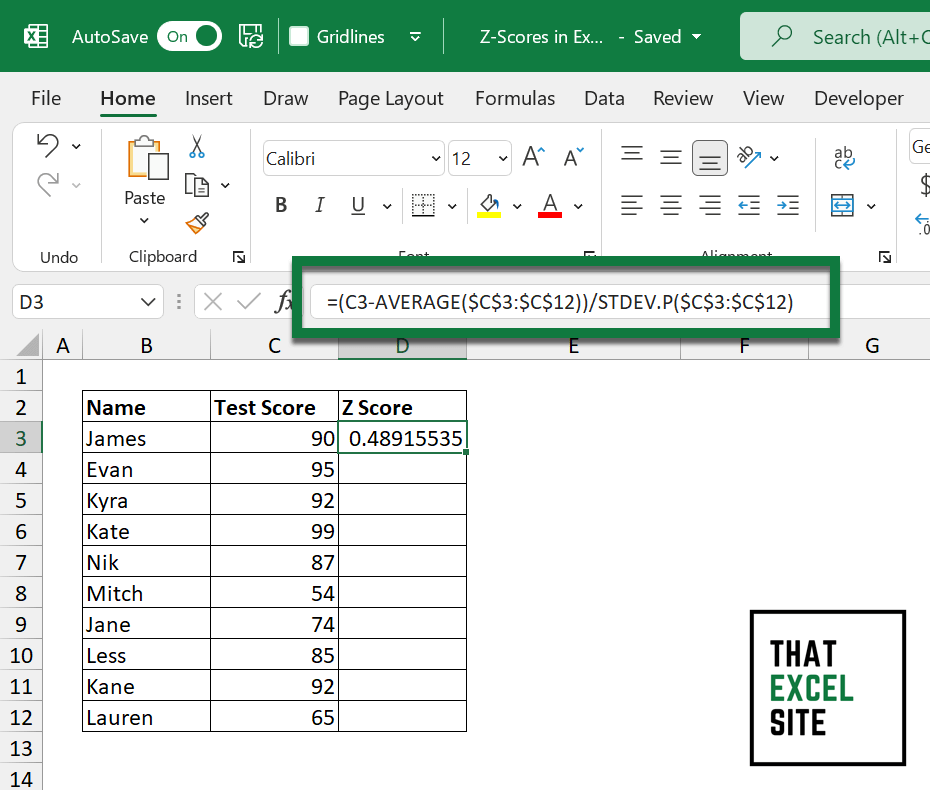
When we hit the Return key, we can see that the z-score is calculated for the value. From there, we can select the fill handle and copy the formula down to the end of the column. Because we used absolute references, we were able to copy the formula all the way down.
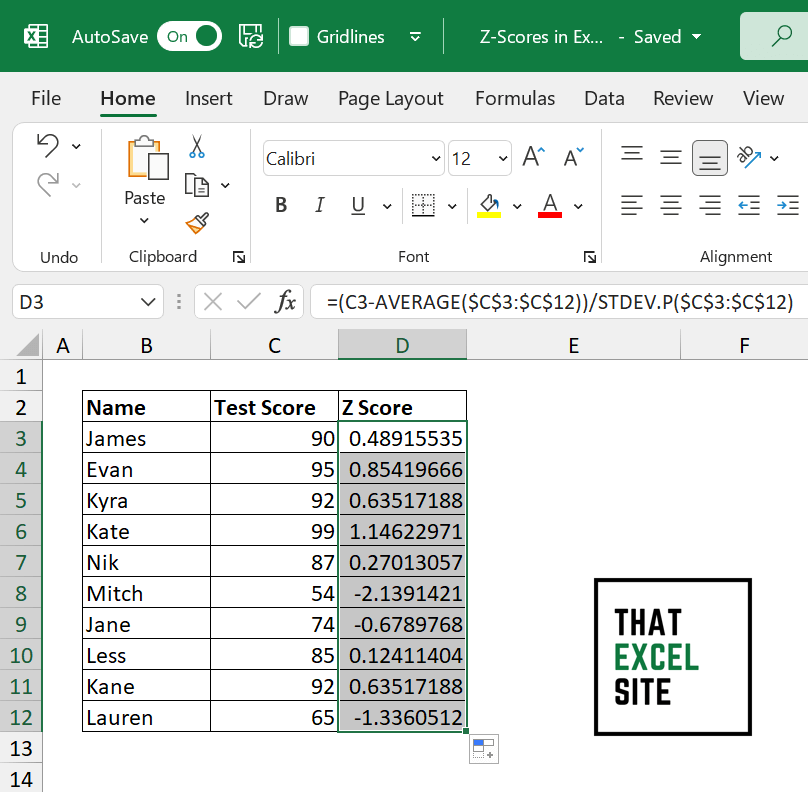
Now we have calculated the z-score for each value in the column. This allows us to better understand how far a student’s grades are from the average of the whole class.
How To Interpret a Z-Score in Excel
A z-score tells you how many standard deviations a value is away from the mean value of the dataset. Because of this, a z-score can be negative, positive, or zero. Let’s break down what these scenarios mean:
- A positive z-score means that the value is higher than the mean value
- A z-score of zero means that the value is equal to the average value
- A negative z-score means that the value is lower than the mean value
The magnitude, or size, of a z-score determines how far away a value is from the mean, relative to the dispersion of the dataset. The z-score allows you to better understand how close a value is in relation to that particular dataset.
Conclusion
In this tutorial, you learned how to use Excel to calculate the z-score of a value. You first learned what the z-score is and how it’s used. Then you learned, how to calculate a z-score of a single value in a dataset, using the functions for standard deviation and averages. From there, you learned how to calculate the z-score for an entire dataset of values. Finally, you learned how to interpret the meaning of a z-score, in the context of a dataset.
Additional Resources
To learn more about related topics, check out the tutorials below: