The standard deviation is a measure of variation in a dataset. It tells you how similar or dissimilar your data is. In this tutorial, you’ll learn how to use Excel to calculate the standard deviation. Thankfully, Excel makes calculating the standard deviation very simple and straightforward. However, there are a number of different functions available to you. This tutorial will guide you through understanding what function to use and when.
By the end of this tutorial, you’ll have learned the following:
- What the standard deviation is and why it matters
- How to use Excel to calculate the standard deviation
- Why Excel offers so many different functions to calculate the standard deviation
What is the Standard Deviation and Why Is It Important?
The standard deviation is a measure of variability in your data, showing you concentrated your dataset is. More specifically, the standard deviation lets you see how close values are to the average. Let’s take a closer look:
- A smaller standard deviation means that data are clustered closer to the average value,
- A larger standard deviation means that data are more spread out from the average value.
Thankfully you don’t need to ever use the actual formula for calculating the standard deviation! Excel provides a lot of different functionality for calculating it using simple Excel formulas!
Let’s take a look at two different datasets:
- Dataset #1: 1, 100, 25, 30, 99, 12, 20, 1, 100, 98
- Dataset #2: 45, 47, 49, 50, 50, 51, 53, 55, 57, 43
We can see, logically, that the first dataset is more spread out than the second. However, the standard deviation gives us a numeric value of how spread out the data are!
Comparing Different Excel Functions for Standard Deviation
There are two main ways of calculating standard deviations: for a sample of data and for an entire population of data.
- To calculate the standard deviation for a sample, you can use the
STDEV.S(),STDEVA(), andSTDEV()functions, - To calculate the standard deviation for a population, you can use the
STDEV.P(),STDEVPA(), andSTDEVP()functions.
In most cases, you’ll be calculating the standard deviation for a sample of data. Because of this, we’ll focus on using the STDEV.S() function.
Let’s compare how all of the different functions work in Excel:
| Name | Data Type | Text and Logical Values |
|---|---|---|
| STDEV() | Sample | Values are ignored |
| STDEVP() | Population | Values are ignored |
| STDEV.S() | Sample | Values are ignored |
| STDEV.P() | Population | Values are ignored |
| STDEVA() | Sample | Values are Evaluated |
| STDEVPA() | Population | Values are Evaluated |
Calculate Standard Deviation in Excel Using STDEV() and STDEV.S()
Excel provides two simple functions for calculating the standard deviation of a sample:
STDEV()andSTDEV.S()
Both of these functions work in the same way, but the latter was introduced in Excel 2007 to be more explicit about using a sample of data. Because of this, we’ll use the new function.
The STDEV.S() function calculates the standard deviation of numeric data, ignoring text data and logical data.
Let’s take a look at the formula:
=STDEV.S(number1, [number2],...)The function has only a single required argument: the array, named range, or reference array of data. The additional arguments can include additional pieces of data.
Let’s see how we can use STDEV.S() function to calculate the standard deviation of dataset in Excel. Let’s first take a look at our data:
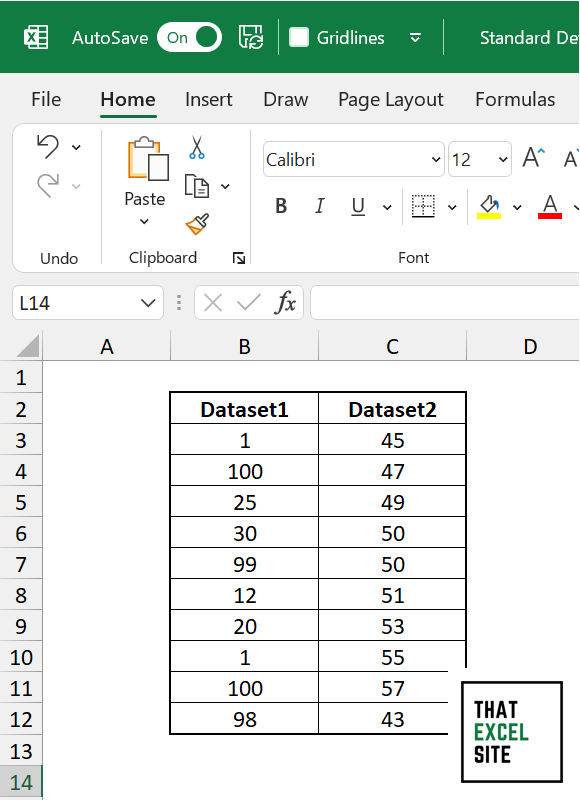
We can see that we have two columns of data, stored in columns B and C of our data.
In order to calculate the standard deviation of our first column, let’s enter cell F2 and enter the STDEV.S() function.
=STDEV.S(B3:B12)We’ll select cells B3 through B12 as the range of our data. When we hit the Return key, Excel will calculate the standard deviation for that column.

We can also calculate the standard deviation for the second dataset by replicating the same process. By calculating the standard deviation of data in cells C3 through C12, we’ll calculate the standard deviation for the second dataset.
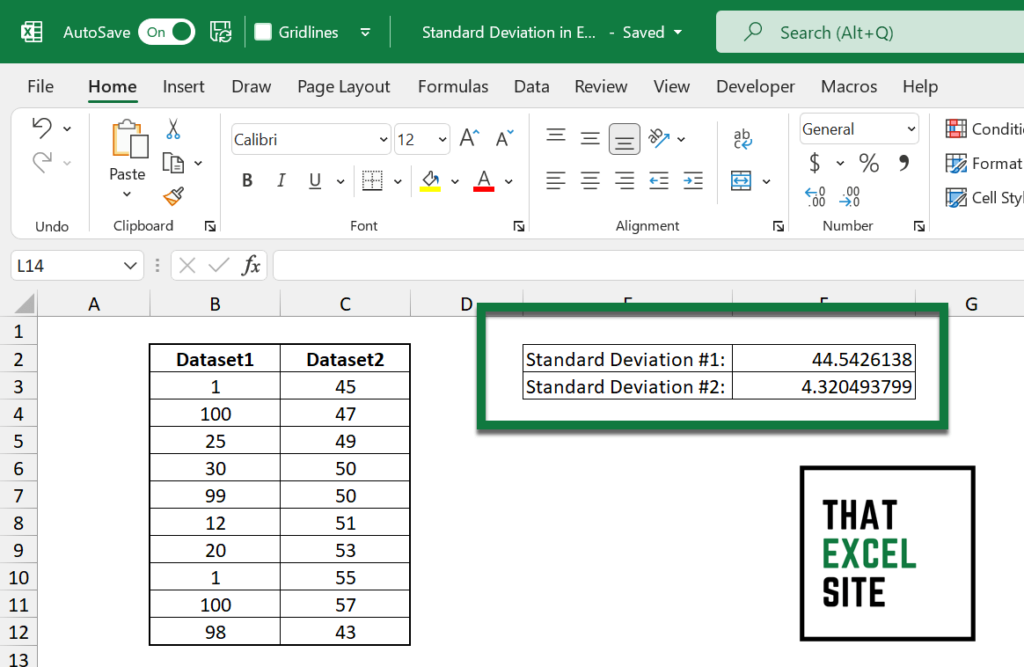
We can see that we have very different standard deviations. Visually, we already knew that the second dataset was more closely clustered together than the first. However, now we have a numeric value to describe the data.
Understanding the STDEVA Function to Work with Text Data
In the previous example, we worked with only numeric data. Because of this, we could use the STDEV.S() function. The STDEVA() function, however, lets us work with data that are non-numeric or contains other errors.
Specifically, the STDEVA() function will treat:
- Text and FALSE values as 0, and
- TRUE values as 1.
Let’s add some text and logical values to our dataset. Because we now have logical (boolean) values and text in our data, the STDEV() function would simply ignore these. However, if we want to include them in our standard deviation calculation, we can simply use the STDEVA() function.
Let’s see what this looks like:
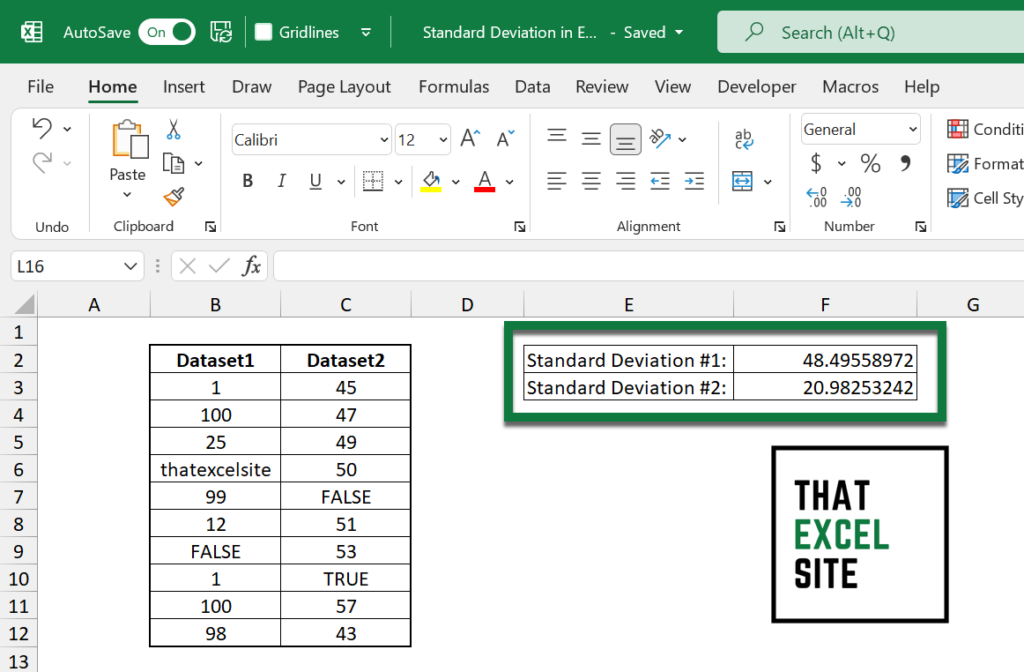
Take a look at the new values. Because the text and logical values evaluate to 0 or 1, our standard deviation values are very different than what they were before!
Understanding the Excel STDEV.P, and STDEVPA Functions in Excel
In the rare cases that you’re calculating a standard deviation for a population of data, you can use the STDEV.P() and STDEVPA() functions. These functions work in the same way as the functions for sample data, but assume you’re working with population data.
Instead of using the STDEV.S() function, we’ll use the population-based STDEV.P() function. Replicating this for the other column works in the same way as the examples above, but allows you to use population data rather than sample data.
Conclusion
In this tutorial, you learned how to use Excel to calculate the standard deviation of a dataset. You first learned what the standard deviation represents and why it’s important. You then learned about all of the different functions that Excel offers. From there, you learned how to calculate the standard deviation of a sample of data, first working with only numeric data and then non-numeric data. Finally, you learned how to work with population data to calculate a standard deviation in Excel.
Additional Resources
To learn more about related topics, check out the tutorials below: