The mean squared error is frequently used to measure the accuracy of the prediction of a dataset. In this tutorial, you’ll learn how to calculate the mean squared error in Excel. First, you’ll learn how the MSE is calculated and what it represents. Then, you’ll learn how to calculate the mean squared error using Excel.
By the end of this tutorial, you’ll have learned the following:
- How to calculate the mean squared error in Excel using the RSQ() function
- How the mean squared error is calculated and what it represents
- The effect that outliers have on the mean squared error
Understanding the Mean Squared Error
What is the mean squared error?
The mean squared error measures the average of the squared values of the errors. This means that the MSE returns the mean of the sums of the square of each difference between the estimated value and the true value.
The formula for the mean squared error is:

The formula may look complicated, but it’s actually quite simple. You are simply calculating the average of the squared values of the differences between actual and predicted values.
The mean squared error will always be 0 or a positive number. The closer the MSE is to zero, the more accurate our predicted values are. The measure is useful because it includes the variance of the estimator, as well as its bias.
It’s also important to note that there isn’t really a “target” value for a mean squared error. Because the mean squared error is relative to the data that you’re working with, what a good mean squared error depends on the data you’re working with.
How to Calculate the Mean Squared Error in Excel
In this section, you’ll learn how to calculate the mean squared error in Excel. While there is no built-in function for this, we can make use of squaring values in Excel as well as calculating average values.
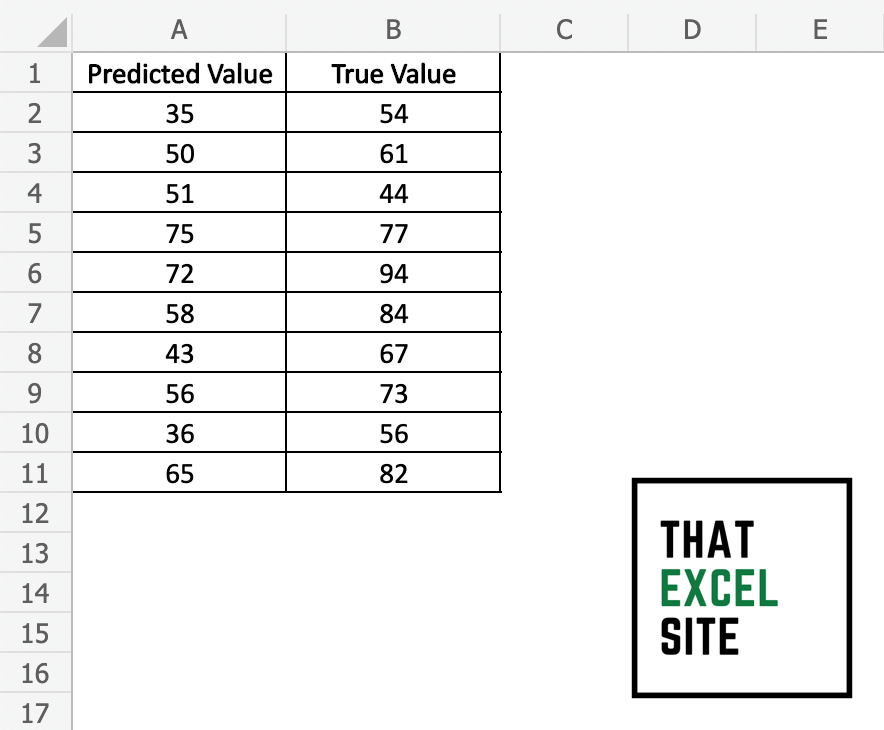
Let’s take a look at the high-level steps required to calculate a mean squared error in Excel using an example. We’ll work with some sample data that compares the predicted and actual values of a fake dataset.
The sample dataset that we’re working with contains 10 values per column. One column contains the predicted values and the other contains the actual values. Let’s take a look at what it looks like:
Now, let’s take a look at how we can calculate the mean squared error in Excel.
How to calculate the mean squared error in Excel
Calculate the difference between predicted and actual values
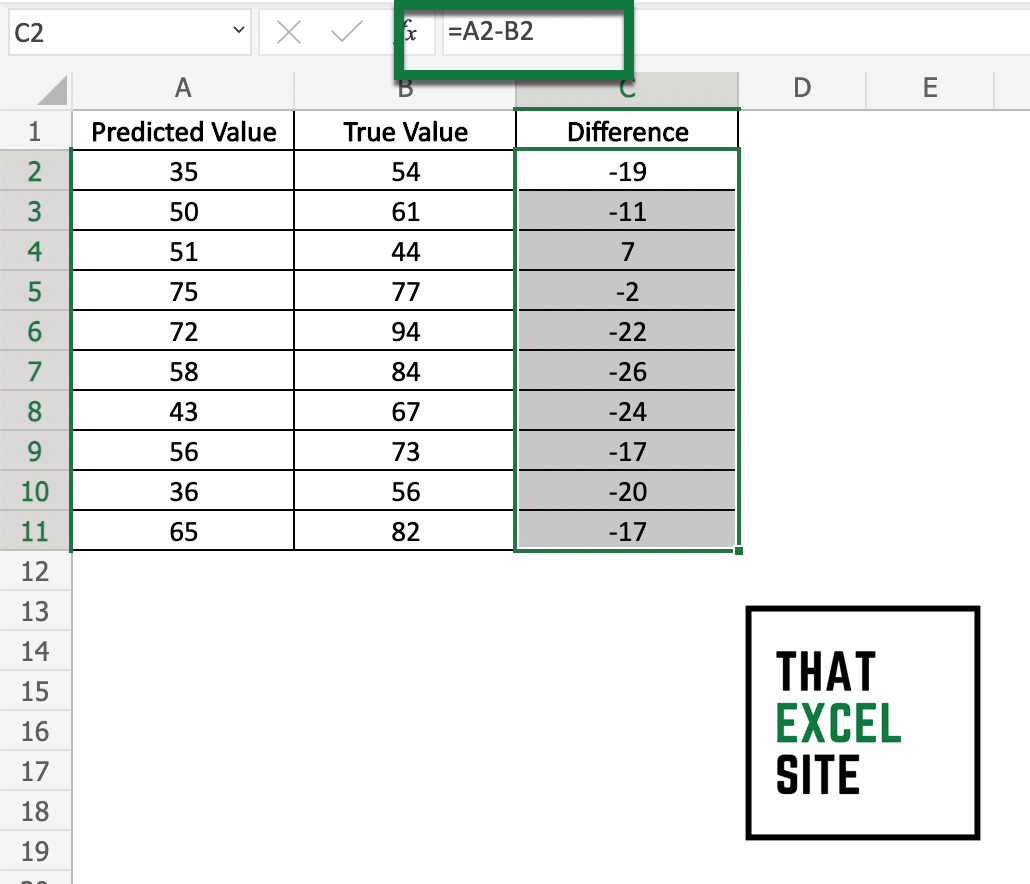
Subtract the predicted value from the actual value using a simple subtraction, such as =B2-A2. Do this for every value in your dataset by dragging the fill handle all the way down the column.
Square the difference between the actual and predicted values.
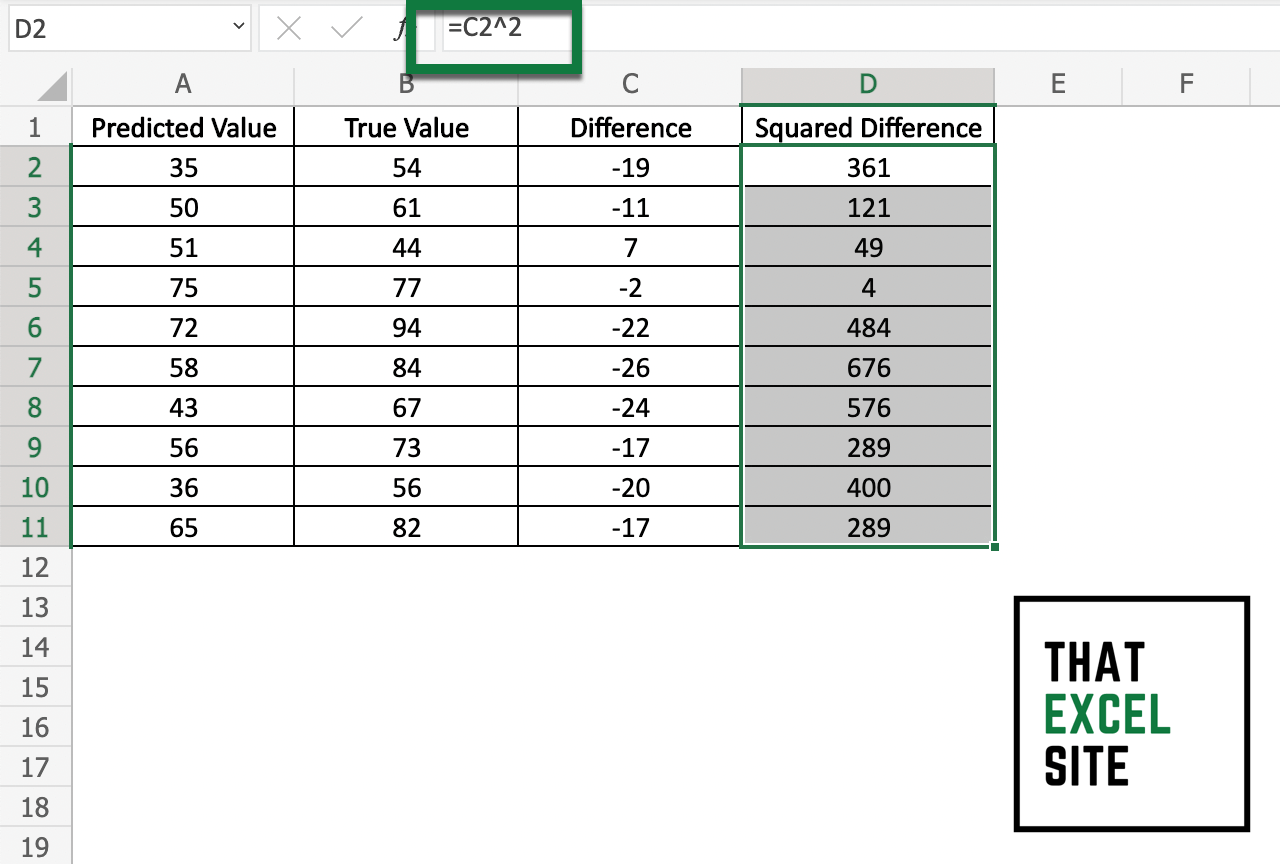
Square the differences you calculated. This can be done by applying the carat ^ operator to the value, such as =C2 ^ 2. Do this for every difference you calculated by dragging the fill handle all the way down the column.
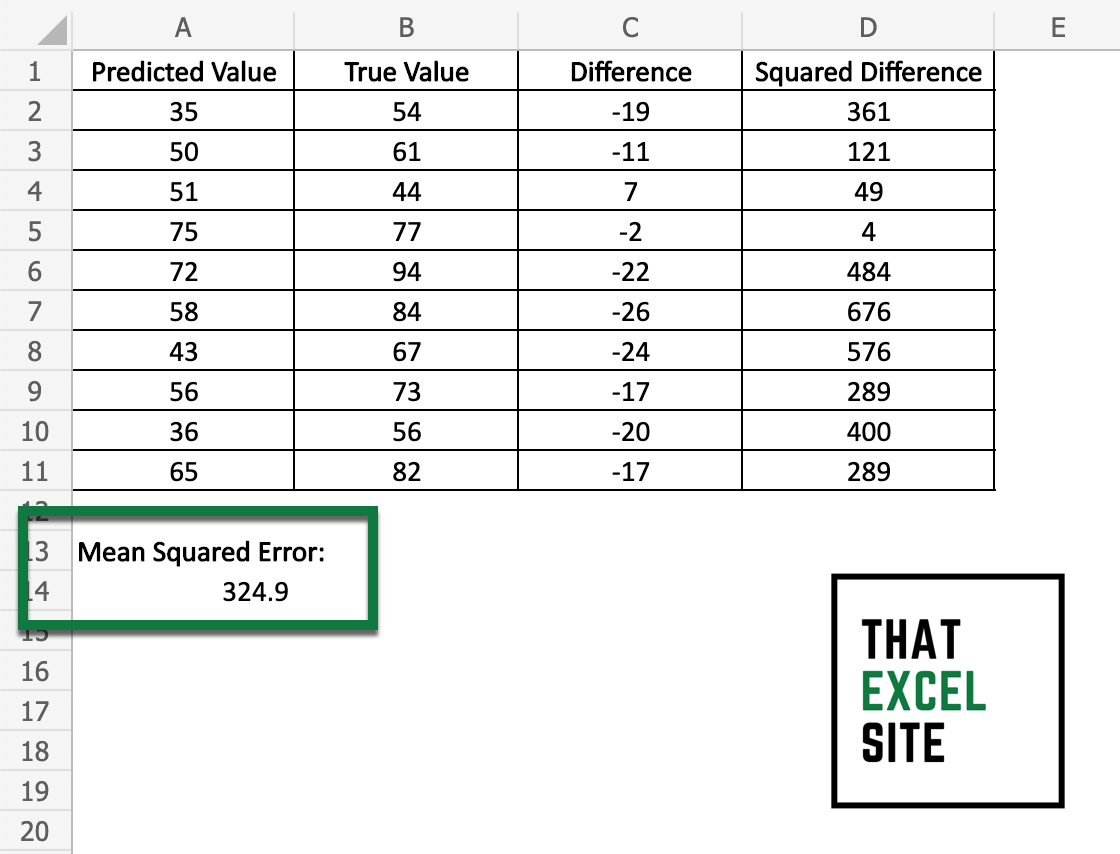
Calculate the mean squared error by finding the average of the squares.
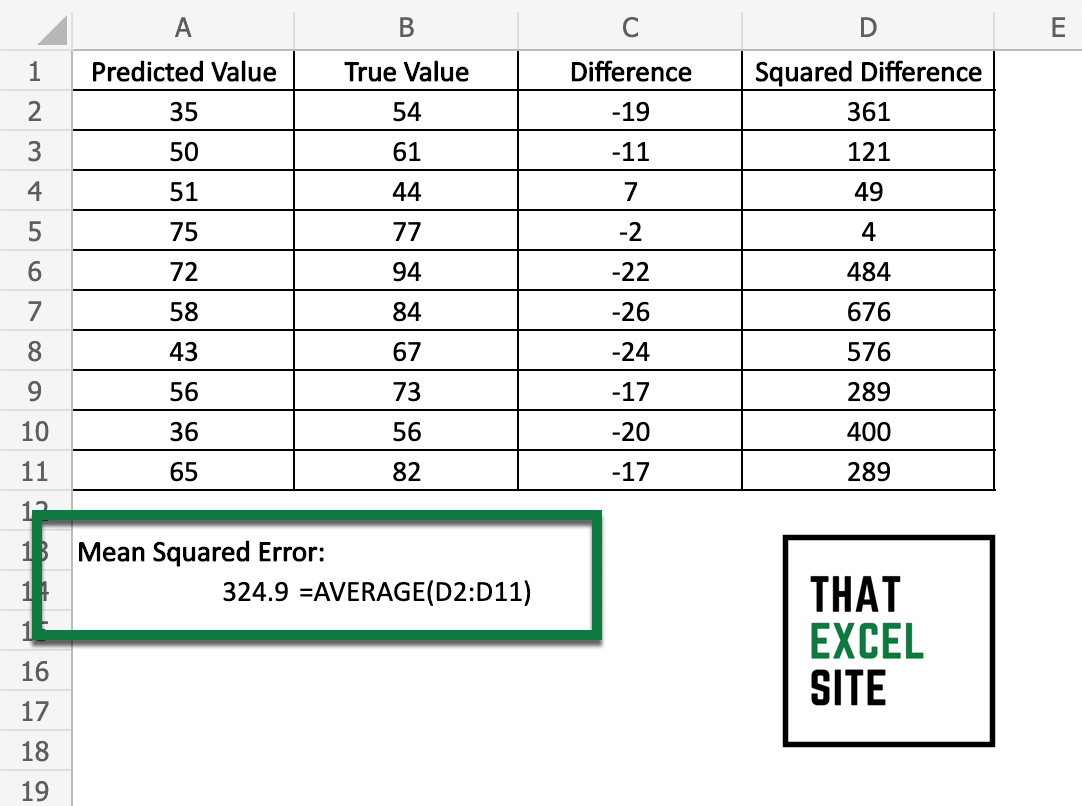
In order to calculate the average, you can use the AVERAGE() function. Simply pass in the range of values that contain the squares.
In the example above, we received a mean squared error of 324.9.
Understanding the Effect of Outliers on MSE
However, the MSE is sensitive to outliers. Because it calculates the squared difference, the impact of outliers will be amplified. Because of this, it’s very important to really understand the data that you’re working with. If the MSE seems unnaturally high based on your domain knowledge, take a look at outliers in the dataset. In some cases, outliers are related to data entry errors and are worth looking into.
Similarly, very small errors will be made even smaller. For example, an error of 0.5 will decrease to 0.25 when squared.
Conclusion
In this tutorial, you learned how to use Excel to calculate the mean squared error. You first learned what the mean squared error represents and how it’s calculated. Following that, you learned how to use Excel to calculate the mean squared error. You learned how to do this by squaring values and calculating their average.
Additional Resources
To learn more about related topics, check out the tutorials below: