
In many sectors, you’ll need to forecast values. For example, working in sales, you may forecast how many sales you’ll have in a given month. In order to evaluate how well your predicted values performed, it’s essential to have a way to evaluate performance. One of these error statistics is the mean absolute percentage error. In this tutorial, you’ll learn how to calculate the mean absolute percentage error (MAPE) in Excel.
By the end of this tutorial, you’ll have learned the following:
- How to calculate the mean absolute percentage error (Excel) in Excel
- What the mean absolute percentage error is
- Notes to keep in mind when using the mean absolute percentage error
Understanding the Mean Absolute Percentage Error (MAPE)
What is the mean absolute percentage error (MAPE)?
The mean absolute percentage error measures how accurate a model is by calculating the average absolute percentage error. One of the main benefits of MAPE is that it is very easy to understand, even for non-technical users. The mean absolute percentage error represents, on average, how far away as a percentage a predicted value was its true value.
The MAPE is quite simple to understand because it’s expressed as a percentage. This means that it doesn’t depend on understanding the units being used. For example, a MAPE of 3% indicates that, on average, the model’s predictions were off by 3% in either direction.
The smaller the mean absolute percentage error, the better. As you’ll learn in a following section, there is no universal standard for what makes a good or bad MAPE.
Let’s take a look at how the mean absolute percentage error is calculated:
MAPE = (1/n) * Σ(| actual – forecast | / | actual |) * 100While this may look complicated, don’t worry, we’ll break it down step by step.
Follow the steps below to calculate the mean absolute percentage error:
- Calculate the absolute difference between the actual and forecasted value for every record in your dataset
- Divide the absolute difference by the absolute value of each record
- Multiply these values by 100 to convert them into percentages
- Sum of all of these values
- Divide this number by the number of records in the dataset
See – that wasn’t so bad? While there are a few steps involved in the process, it’s quite simple to do in Excel! Let’s dive into this in the next section.
Working with Zero Values
It’s important to note that your actual values should not be equal to zero. This is because you’ll be dividing the error by zero, which is mathematically impossible.
How to Calculate the Mean Absolute Percentage Error (MAPE) in Excel
While there is no built-in way to calculate the mean absolute percentage error in Excel, it’s a simple task using other built-in functions. Take a look at the easy-to-follow steps below to learn how to calculate the MAPE:
How to Calculate the Mean Absolute Percentage Error in Excel
Load your forecasted and actual values into two columns in Excel
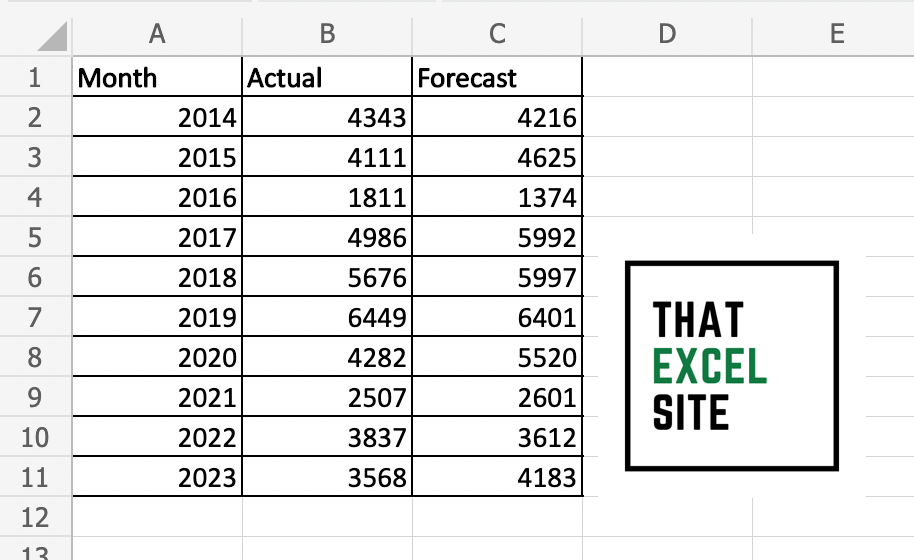
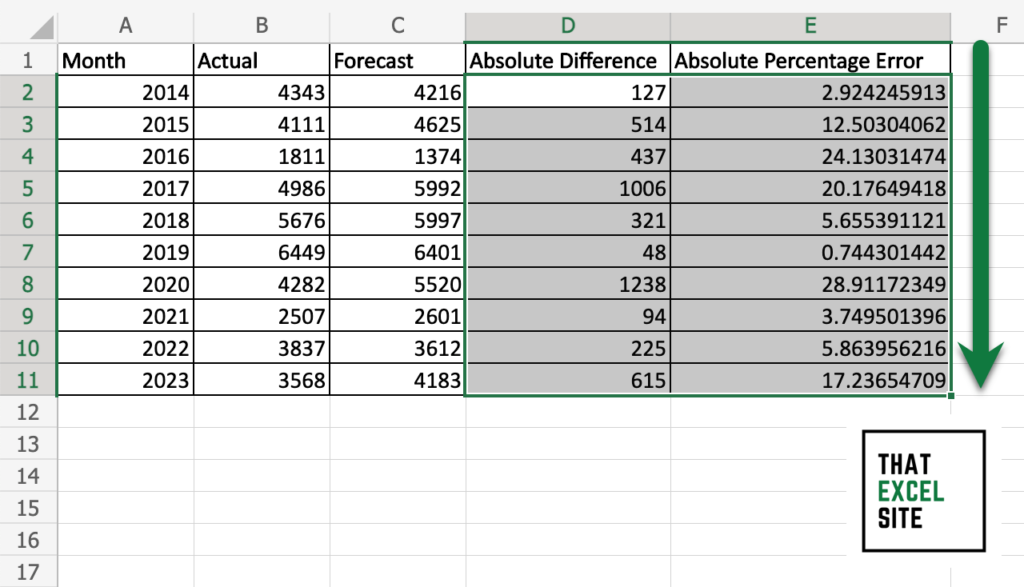
In the dataset above, we have three columns: the forecasted year, the forecasted value, and the actual value. This will allow us to calculate the MAPE based on 10 observations.
Calculate the absolute difference between actual and predicted values
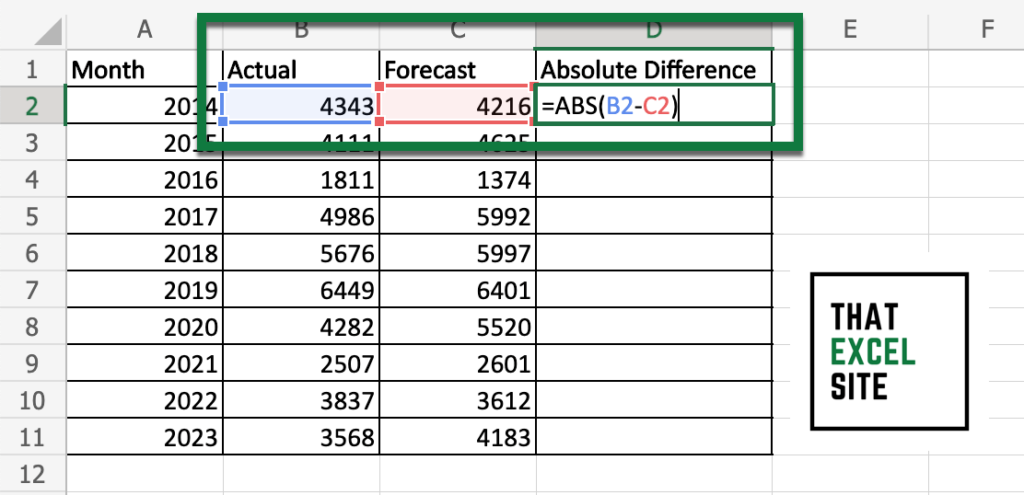
Subtract your actual value from the predicted value and convert it to an absolute value using the ABS() function. This should look like: =ABS(B2-C2). Since we’re calculating the absolute value, it doesn’t matter which value you’re subtracting from the other.
Divide this value by the absolute actual value and multiply by 100
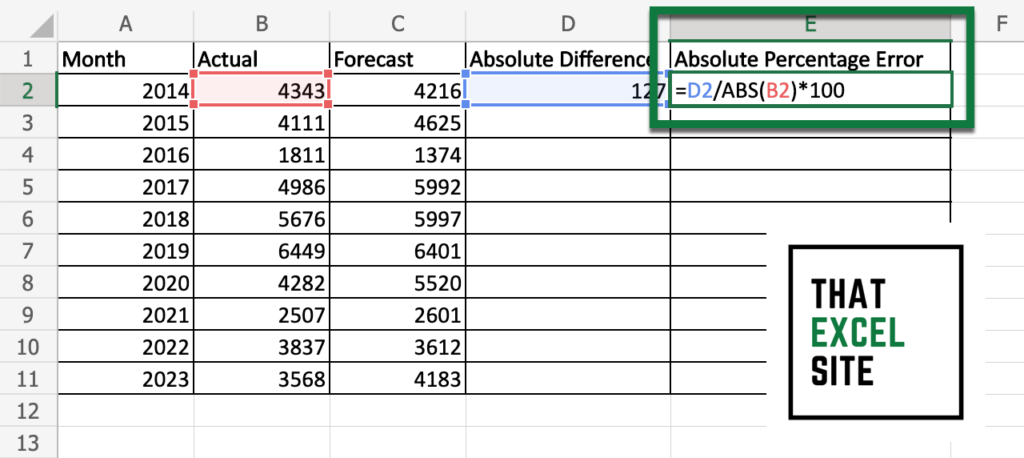
Calculate the absolute percentage error for the record by dividing the value by the actual value. This will look like: =D2 / ABS(B2) * 100
Repeat this process for every record in your dataset
Select your two calculated values and drag the fill handle down to the end of your dataset. Keep in mind that Excel will not be able to handle this division when the actual value is 0. In fact, Excel will raise a #DIV/0 error if this happens.
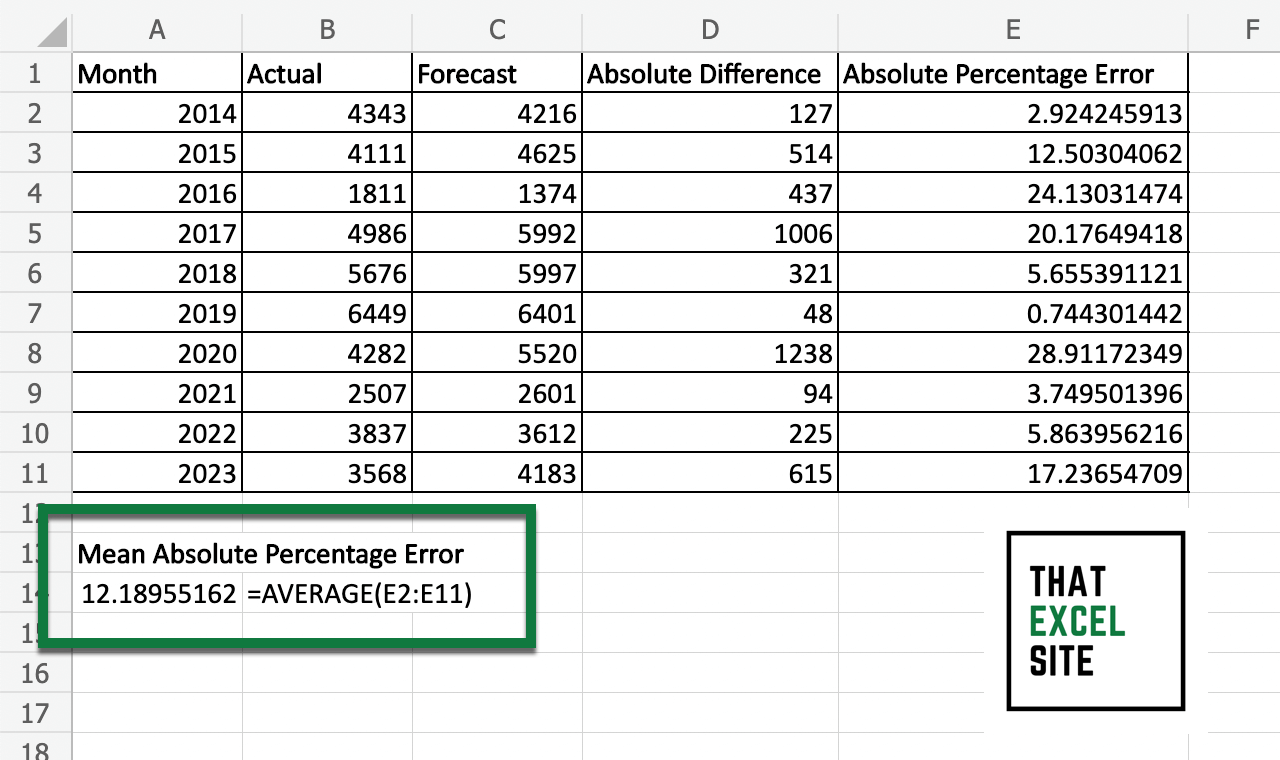
Calculate the average of the absolute percentage errors

Using the AVERAGE() function, you can calculate the mean absolute percentage error of the dataset. This will return the MAPE for your data.
In the example above, we can see that the mean absolute percentage error was XYZ. This means that our predicted values were, on average, XYZ inaccurate.
Working with the Mean Absolute Percentage Error
Now that you know how to calculate the mean absolute percentage error, let’s dive a little further into how to actually work with the error. As I mentioned earlier, there is no standard for what makes a good percentage error. The reason for this is that some industries have different thresholds for error.
For example, in medicine, a MAPE of 1% may be considered a failure, given that people’s lives are at stake. Meanwhile, in finance, a MAPE of 1% may be considered a huge success. What a good value for your mean absolute percentage error depends entirely on the context of your data.
In general, however, the lower the mean absolute percentage error, the better. This is because a lower MAPE will indicate that the actual values were closer to the predicted values.
General Rules for the Mean Absolute Percentage Error
There are a number of general rules for working with the mean absolute percentage error:
Your actual values should not be equal to zero. This is because you would then be dividing a value by zero, which is not mathematically possible, and would result in a DIV/0! error.
Working with lower-range values will yield erratic results. Working with smaller values where, say, the values range between 0-10, will yield larger changes in the MAPE.
For example, if a predicted value is 4 and the actual value is 2, then the error will be 50%. Meanwhile, if the predicted value is 1002 and the actual value is 1000, the error will only be 0.2%. This is true, even though the models were off by the same value. This doesn’t mean the MAPE is incorrect, but that you need to be mindful of the context of your data.
Conclusion
In this tutorial, you learned how to calculate the mean absolute percentage error, or MAPE, in Excel. When working with predictive models, it’s important to be able to evaluate the performance of your model. The mean absolute percentage error is a useful statistic to be able to measure the effectiveness and accuracy of your model. Because the model is simple and easy to understand, it’s a good one to use to communicate with non-technical audiences.
You first learned what the mean absolute percentage error is and how it is calculated. Then, you learned how to calculate the MAPE in Excel using other built-in functions. Finally, you learned how to interpret the MAPE and some considerations as to when to use it.
Additional Resources
To learn more about related topics, check out the tutorials below: