Normalizing is a common task in working with large datasets, especially when working in machine learning, data science, and statistics. It’s also often a misunderstood term. In general, normalization refers to scaling values to fit inside a certain range.
In most cases, however, it refers to normalization by way of min-max scaling, which returns a range of values from 0 through 1. In other cases, normalization may refer to standardization, where values are centered around a mean of 0 and a standard deviation of 1. In this tutorial, you’ll learn how to normalize and standardize data in Excel.
By the end of this tutorial, you’ll have learned the following:
- How to normalize data in Excel using the min-max scaling method to 0 through 1
- How to standardize data in Excel to a mean of 0 and standard deviation of 1
- How to interpret normalized datasets
Understanding Normalization and Standardization of Data
The term normalization is often thrown around in statistics, business, and data science. In most cases, normalization refers to two different processes:
- Standardization to a mean of 0 and a standard deviation of 1
- Normalization to a minimum of 0 and a maximum of 1 using min-max scaling
What does it mean to normalize data?
Normalization refers to scaling data so that the minimum value is equal to 0 and the maximum value is equal to 1. This process is often referred to as min-max scaling. Standardization is often also referred to as normalization – in this case, the dataset is modified so that the mean is equal to 0 and the standard deviation is equal to 1.
Standardization and normalization allow you to work with data of different scales more effectively. Imagine having a dataset that compares a person’s income and height in centimeters. Likely, these values will be in completely different scales. Because of this, looking at their means or standard deviations would not be comparable.
By normalizing the dataset, you’re able to more readily compare and contrast datasets that have very different scales! Let’s dive into how you can use Excel to standardize and normalize datasets.
How to Normalize Data in Excel Between 0 and 1
Standardizing data is quite simple using built-in operators and functions, such as the MIN() and MAX() functions.
Mathematically, we normalize value using the formula below:

In the example above, you scale each value in a dataset by subtracting the minimum value from the value and dividing it by the difference between the max and minimum values. Let’s break this down, step-by-step:
- Subtract the minimum value in the dataset from the value
- Divide this difference by the difference between the maximum and minimum values of the dataset
- Repeat this for each item in the dataset
Let’s see how we can normalize data in Excel:
Step 1: Load the dataset you want to normalize
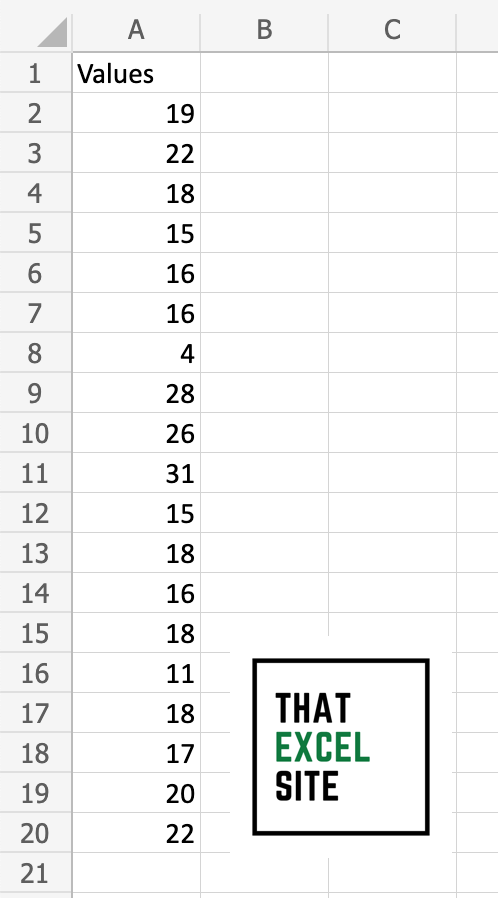
In our sample dataset, we have values ranging from 4 to 31. By using min-max scaling, all of our values will range from 0 to 1.
Step 2: Calculate the minimum value in the dataset using the MIN() function
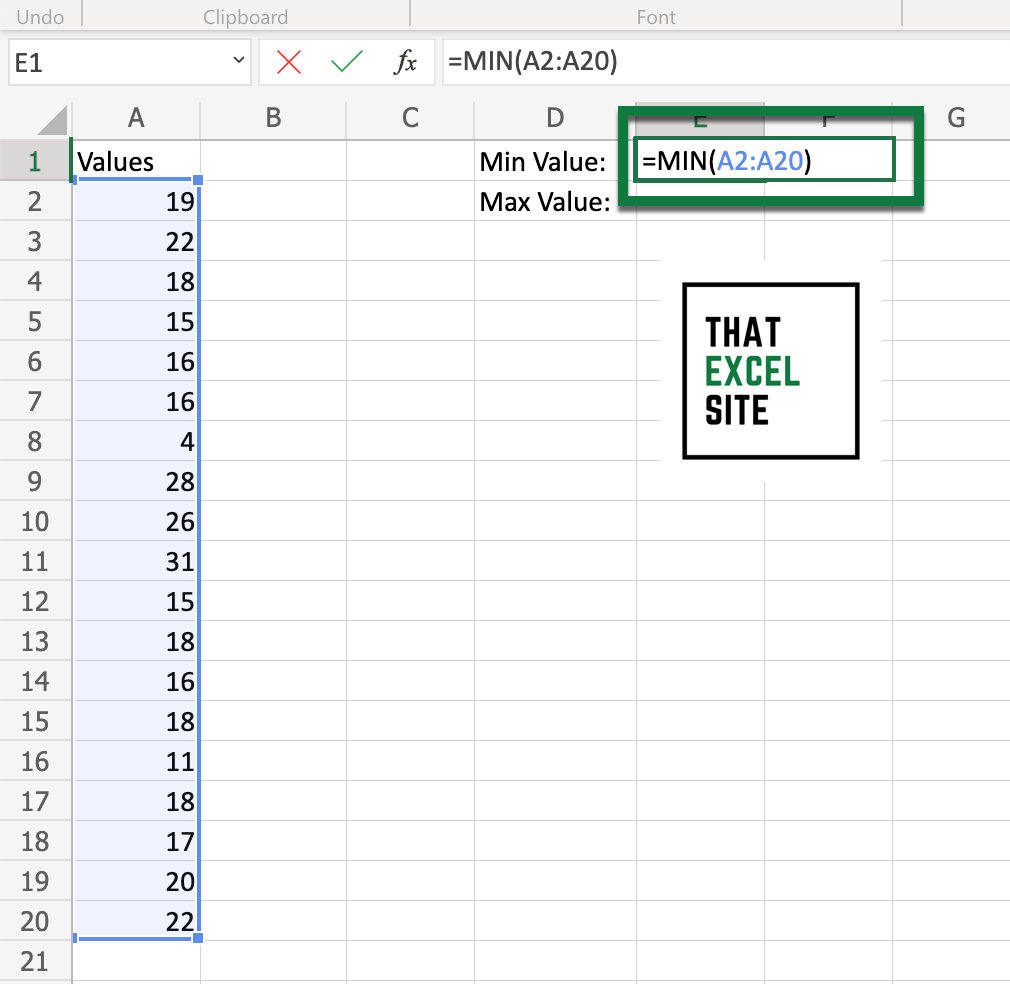
Use the MIN() function to calculate the minimum value of the dataset. In this case, this returns 4.
Step 3: Calculate the maximum value in the dataset using the MAX() function
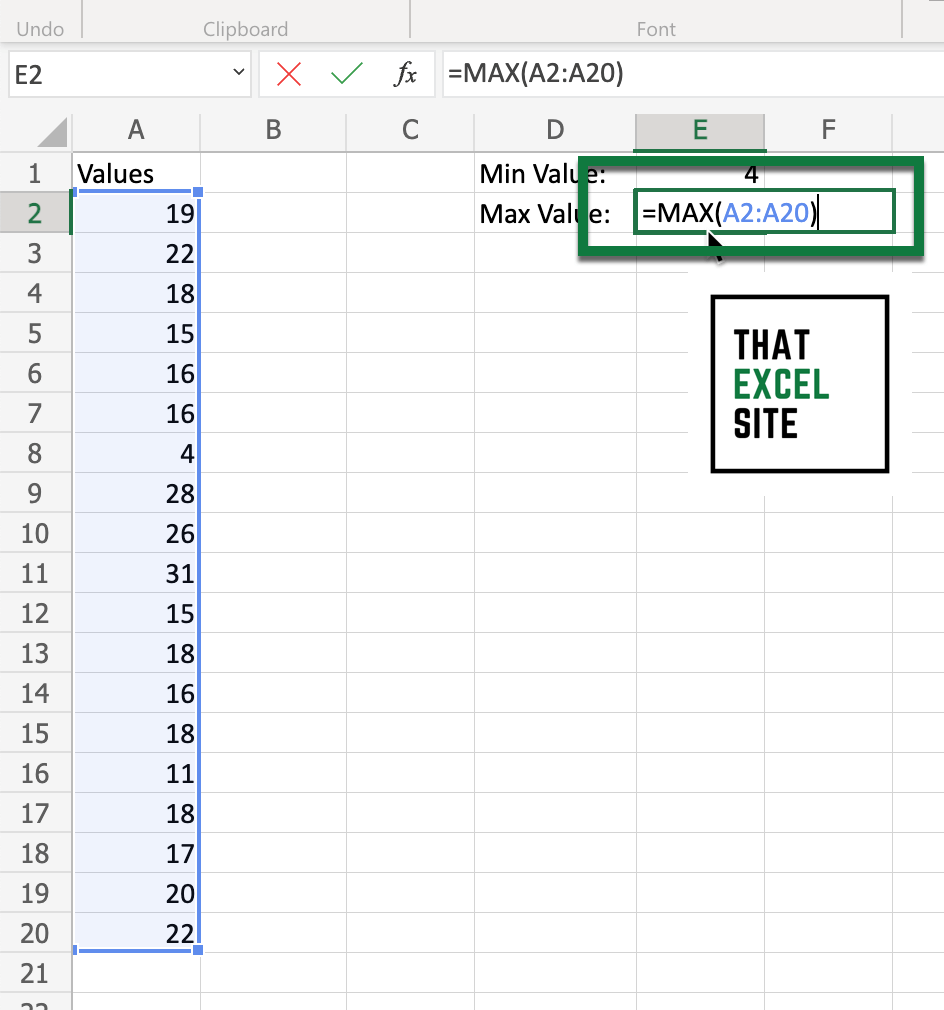
Use the MAX() function to calculate the maximum value of the dataset. In this case, this returns 31.
Step 4: Normalize the first record by subtracting the minimum value from the observation and dividing by the range of the dataset
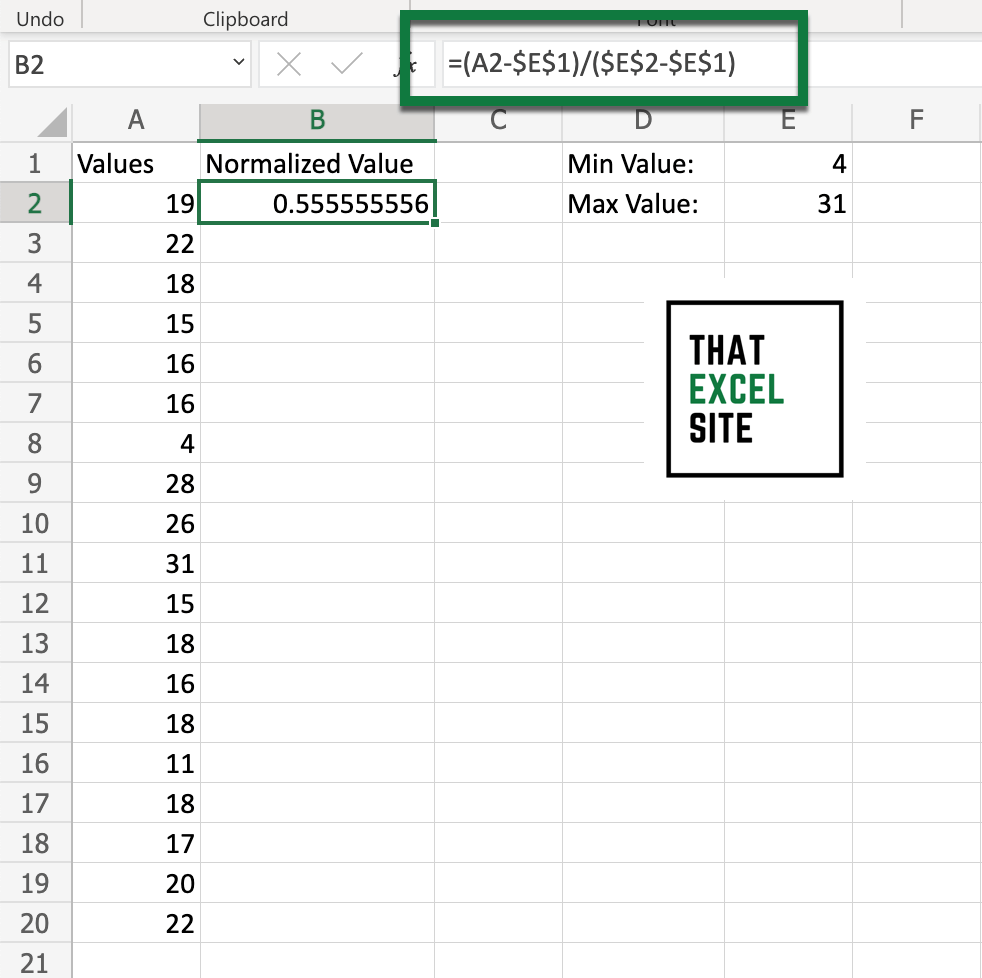
To normalize a single value, subtract that minimum value from the record itself. Then, divide this number by the range of the data (the maximum value subtracted by the minimum value).
Step 5: Drag the fill handle down to normalize all records in the dataset
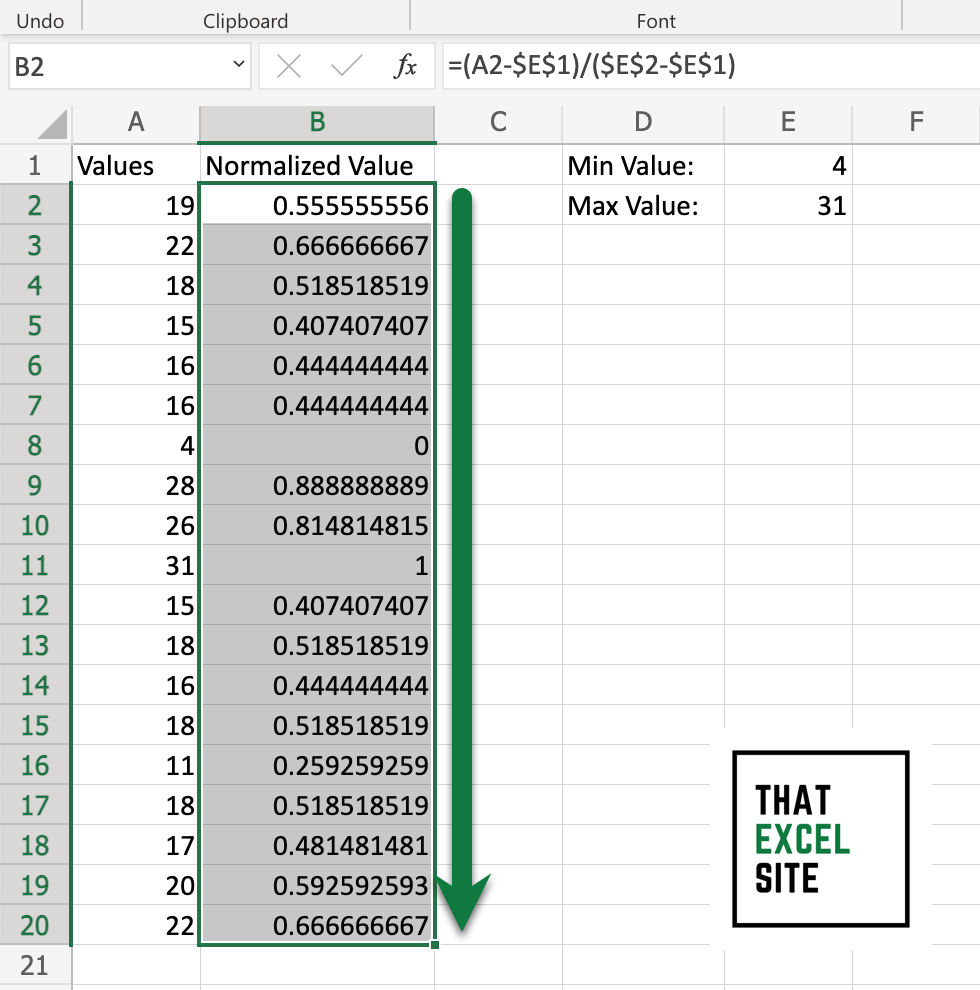
To normalize the entire dataset, simply drag the fill handle all the way down. Because we’re using absolute references for the minimum and maximum values of the dataset, we don’t have to worry about values changing through relative references.
In our normalized dataset, all of the values are between 0 and 1. By normalizing multiple datasets, we can easily compare datasets of different ranges. In the following section, you’ll learn how to standardize values – another common method of allowing you to compare datasets of different ranges.
How to Standardize Data in Excel to a Mean of 0 and Standard Deviation of 1
Standardizing data in Excel is possible by using the built-in STANDARDIZE() function. The function has a powerful method built into it that allows you to normalize values using their mean and standard deviation.
The formula for standardization may look a little bit more complicated, but it’s nothing we can’t handle!
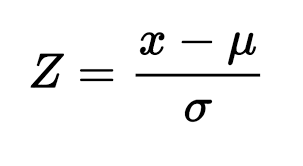
Let’s break this formula down a little bit:
- Subtract the mean from each value in the dataset
- Divide this difference by the standard deviation
Excel makes this process quite simple by using built-in functions, including STDEV(), AVERAGE(), MIN(), and MAX(). Let’s see how we can use Excel to standardize a dataset.
Step 1: Load the dataset you want to standardize
We’ll use the same dataset that we used earlier in the tutorial. The values range from 4 to 31.
Step 2: Calculate the mean of the dataset
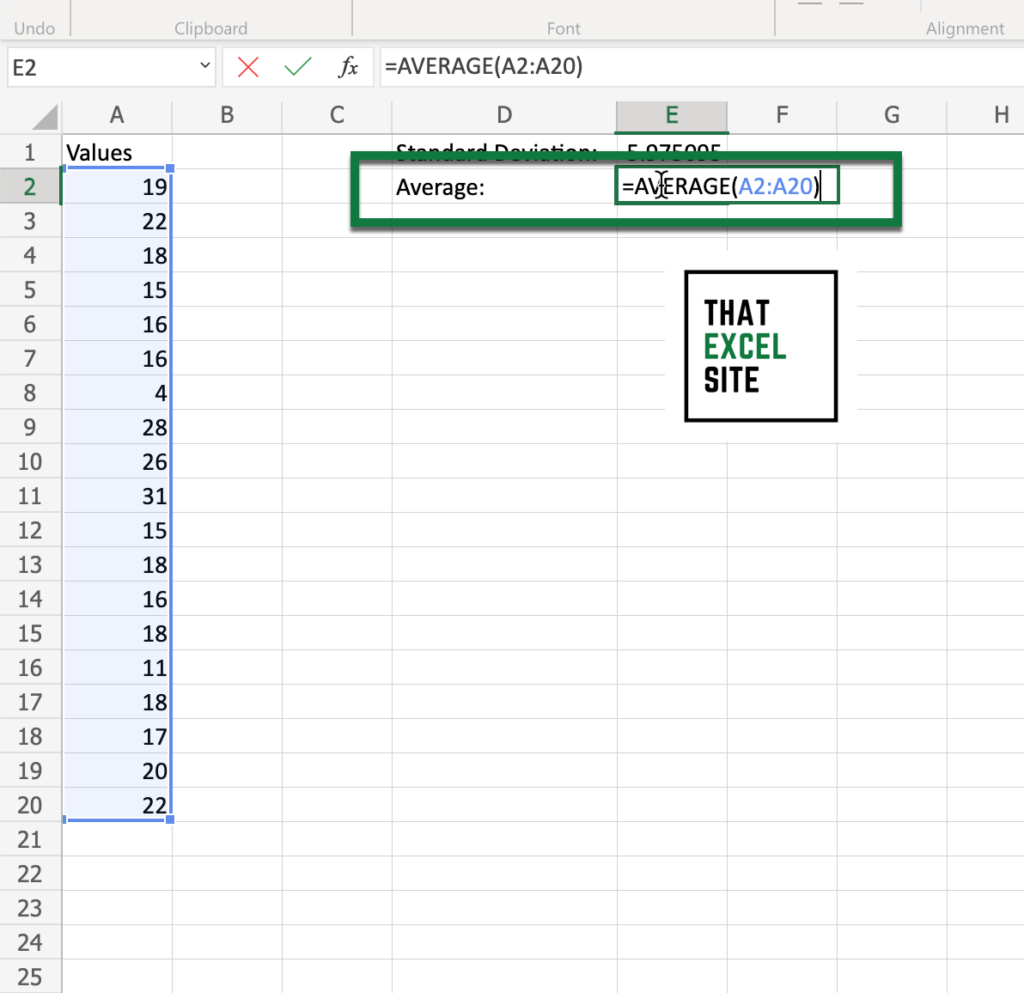
We’ll start off by calculating the average value of the dataset. In this case, we’re using the AVERAGE() function since our values are completely numeric and don’t have text or logical values.
Step 3: Calculate the standard deviation of the dataset
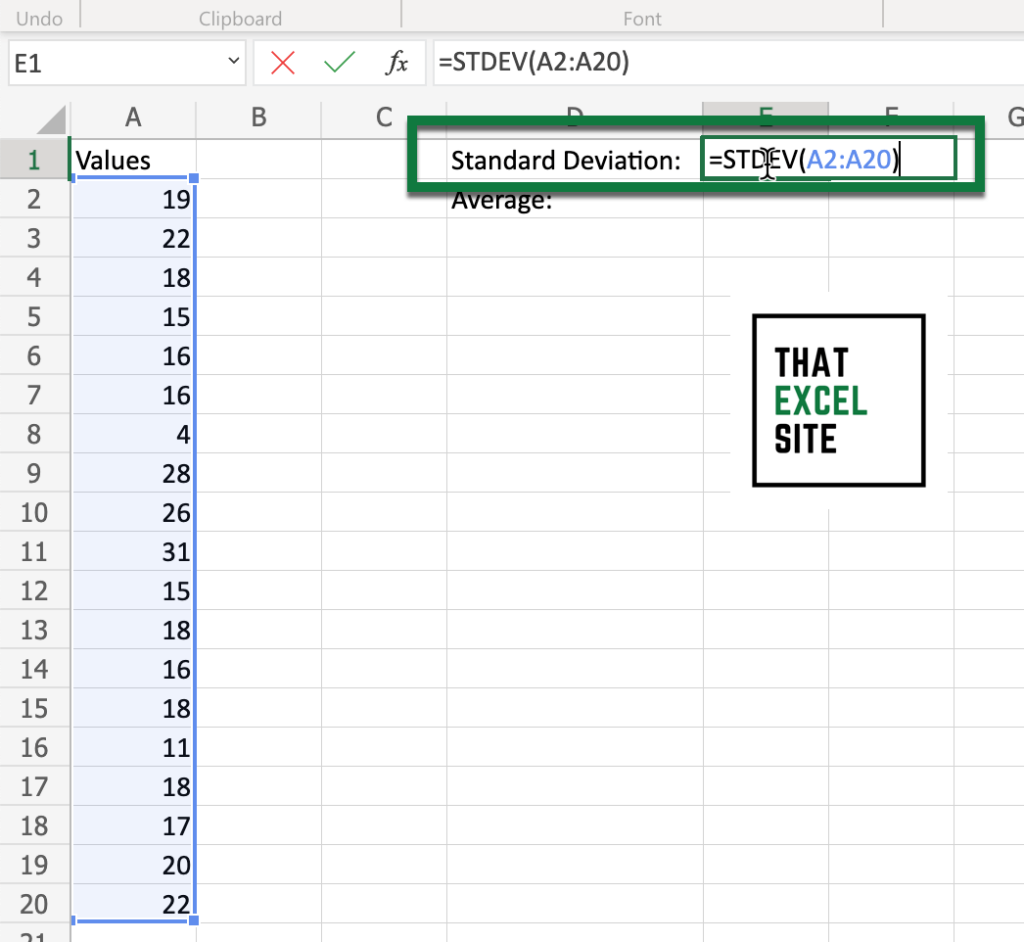
Then, we calculate the standard deviation of the dataset. In this case, we’re using the STDEV() function, though Excel provides a number of different functions to calculate a standard deviation.
Step 4: Subtract the mean from the record and divide it by the standard deviation
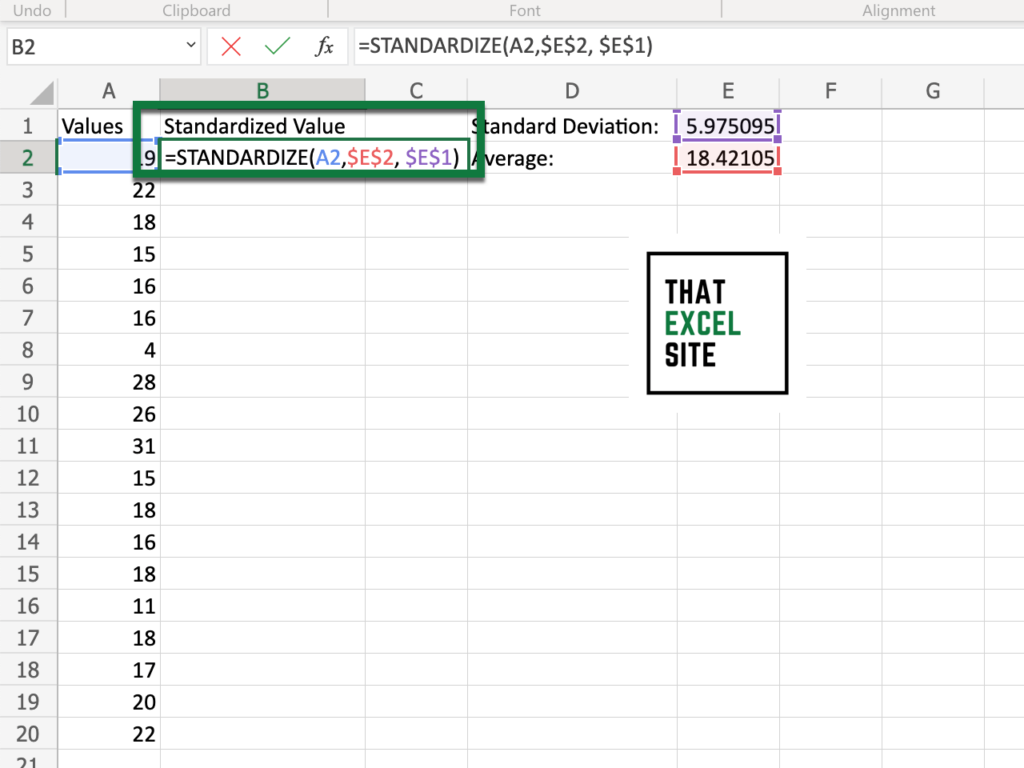
To standardize a single value, we can use the STANDARDIZE() function. The function accepts the following arguments:
x=the value we want to standardizemean=the average value of the datasetstandard_dev=the standard deviation of the dataset
This standardizes the single value so that the mean is 0 and the standard deviation is 1.
Step 5: Drag the fill handle down for the entire dataset
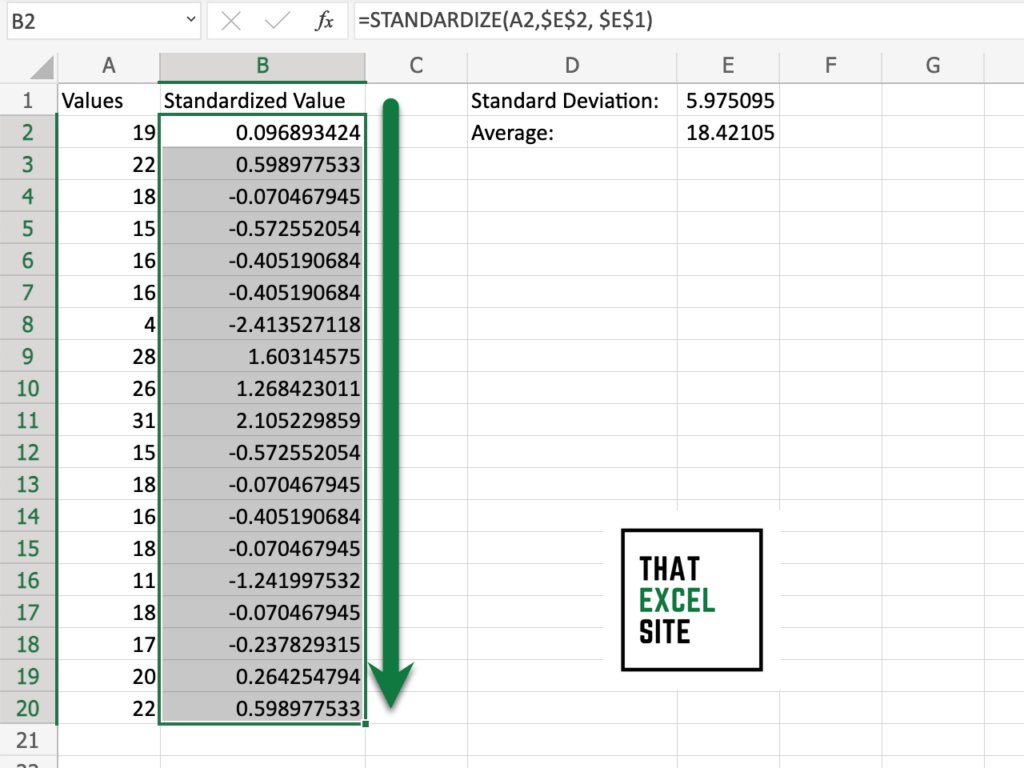
By dragging down the fill handle, we can standardize the entire dataset. Because we’re using absolute references in our dataset, we don’t have to worry about absolute references to modify the behavior. In this case, the close values are to zero, the closer they are to the mean.
How to Interpret Normalized and Standardized Values
In this section, you’ll learn how to interpret normalized and standardized values. Remember, while these terms are often used interchangeably, they actually have very different meanings:
- Normalization often refers to min-max scaling, where values fall between 0 and 1
- Standardization refers to modifying the dataset so that the mean is equal to 0 and the standard deviation is equal to 1
Because of this, when we are working with a normalized dataset, the closer the value is to 1, the closer it is to the maximum value in the dataset. Meanwhile, the closer the value is to 0, the closer the value is to the minimum value of the dataset.
Working with standardized data is a bit different. When a value is closer to 0, it’s closer to the average value of the dataset. If a value is positive, it’s larger than the average value. Inversely, if a value is negative, it’s smaller than the mean of the dataset. The values really represent the z-score of a data point, identifying how many standard deviations it is away from the average value of the data.
Conclusion
In this tutorial, you learned how to normalize and standardize data in Excel. When working with datasets that use different scales or have very different ranges of data, it’s important to find ways in which you can compare the data. While the two terms are often used interchangeably, they represent different measures. You first learned what the two terms mean and how they’re calculated. Then, you learned how to normalize and standardize data in Excel, with step-by-step examples. Finally, you learned how to interpret the values returned by standardizing and normalizing data.
Additional Resources
To learn more about related topics, check out the tutorials below: