The median absolute deviation is a robust measure of the variability of a dataset that gives you a good sense of how closely clustered values are. Similar to the mean absolute deviation, the median absolute deviation gives you a good insight into the variability of your data. CONTINUE
Understanding the Median Absolute Deviation
What is the median absolute deviation?
The median absolute deviation is a measure of dispersion, calculated by finding the median value of the differences between each observation and the dataset’s median value. The measure is robust, meaning that it isn’t affected by outliers.
The median represents the middle value when a dataset’s observations are ordered numerically. Because the median is the middle value, it’s labeled as robust. This means that the value is not affected by outliers.
Let’s see how the median absolute deviation is calculated mathematically:
- Calculate the median of a dataset by ordering your dataset’s records numerically and finding the middle value
- Subtract each observation from the median and find the absolute value
- Find the median value of the absolute differences
Formulaically, the function looks like this:

Now that you have a strong understanding of how the median absolute deviation is calculated, let’s dive into how to calculate it in Excel.
How to Calculate the Median Absolute Deviation in Excel
Excel doesn’t provide a built-in function to calculate the median absolute deviation. This doesn’t mean, however, that you have anything to worry about! You’ll find an easy-to-follow guide below that’ll guide you step-by-step through calculating the median absolute deviation.
How to Calculate the Median Absolute Deviation in Excel
Load the dataset for which you want to calculate the median absolute deviation
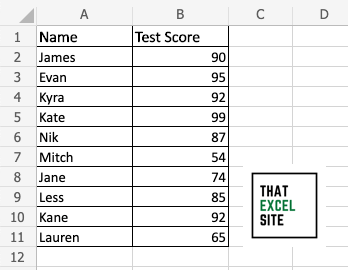
In our example dataset, we’re using a dataset that contains test scores for 10 different people. The scores all fall between 0 and 100 and we want to calculate the median absolute deviation for our students.
Calculate the median value for the dataset using the MEDIAN() function
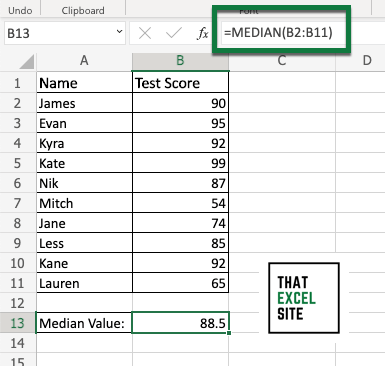
Excel provides a built-in function, MEDIAN(), which allows you to calculate the median value for a dataset. You can pass in a range of values, as we did in the example above, passing in the range B2:B11.
Calculate the absolute difference between each record and the median value
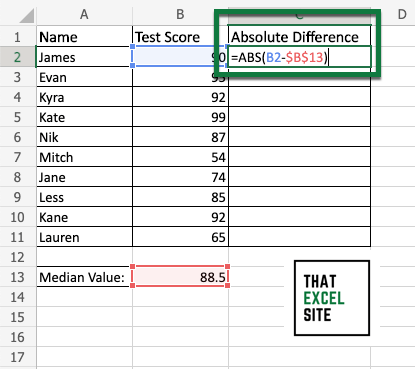
To calculate the absolute difference between two values, you can use the ABS() function. Because we’re calculating the absolute difference, the order you subtract the values in doesn’t matter. Note that for our median value, we’re using an absolute reference, $B$13. This allows us to easily calculate the absolute difference for each record.
Drag the fill handle down to the end of the records to calculate the absolute difference for each value
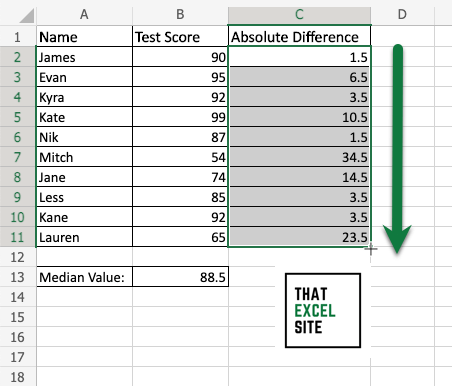
Select the fill handle (the cross hairs icon) and drag it to the bottom of your dataset. Since we’re using an absolute reference, the calculation happens without you needing to modify anything.
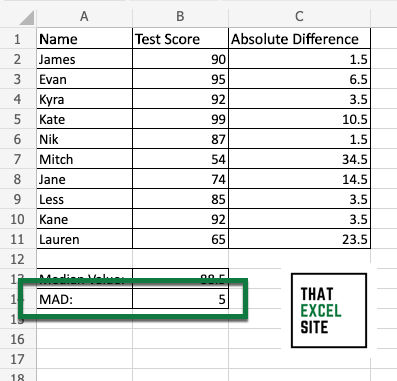
Calculate the median value of the absolute differences
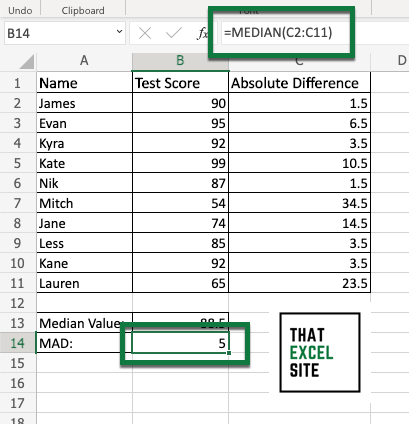
Now we’ll use the MEDIAN() function again to calculate the median absolute deviation. In this case, however, we’ll use the column that contains our absolute differences.
In this case, we were able to calculate a median absolute deviation of 5.
You may remember this dataset from the tutorial on the mean absolute deviation. In that case, we got back a value of roughly 11. We can see that by using the median absolute deviation, rather than the mean absolute deviation, our measure is less influenced by the outliers in the dataset.
How to Interpret the Median Absolute Deviation
The median absolute deviation is a measure of how varied and dispersed a dataset is. Because it uses the median in its calculations, the measure is robust – meaning that it’s not influenced by outliers in the dataset. Compared to other measures of dispersion, such as the mean absolute deviation, very large and very small values don’t influence the measure.
In many ways, the median absolute deviation is similar to the interquartile range. However, the latter is slightly less robust.
The robustness of your measures is incredibly helpful when you’re working with a dataset where the outliers of the data are not important. Similarly, you may want to use the median absolute deviation when you simply don’t want the outliers to influence the measure.
For example, when working with income data, very high-income earners can heavily influence the mean absolute deviation. Because of this, you’ll often encounter the data reported using the median and the median absolute deviation.
Conclusion
In this tutorial, you learned how to calculate the median absolute deviation in Excel. The median absolute deviation provides a helpful measure of dispersion. Compared to other measures of dispersion, such as the mean absolute deviation, the median absolute deviation is robust – meaning that it’s not affected by outliers.
You first learned how to calculate the median absolute deviation mathematically, by breaking the calculation down into steps. Then, you learned how to calculate the median absolute deviation in Excel. Because Excel doesn’t have a built-in function for this, we walked through it step-by-step. Finally, you learned how to interpret the median absolute deviation. You also learned when you may want to use this measure over other, less robust measures, such as when working with income data.
Additional Resources
To learn more about related topics, check out the tutorials below: