The mean absolute deviation (or MAD) is a metric that measures how dispersed values in a dataset are. This means that it measures how spread out your data is. In this tutorial, you’ll learn how to calculate the mean absolute deviation in Excel using the AVEDEV() function. Being able to understand key measures of your dataset, like the interquartile range, can give you a better sense of how your data is structured.
By the end of this tutorial, you’ll have learned the following:
- How to calculate the mean absolute deviation in Excel with AVEDEV()
- What the mean absolute deviation is calculated
- How to interpret the mean absolute deviation
Understanding the Mean Absolute Deviation
What is the mean absolute deviation?
The mean absolute deviation (or MAD) is a measure of dispersion. It tells you how spread out your data are from the mean value of the dataset. Because the mean absolute deviation uses the absolute value, it ignores whether values are above or below the mean.
A lower mean absolute deviation will tell you that your values are more closely clustered around the mean. Meanwhile, a higher mean absolute deviation will indicate that values are more spread out from the mean.
Let’s take a look at an example to better illustrate this. Imagine that you have two datasets, as shown in the table below:
| Dataset #1 | Dataset #2 |
|---|---|
| 13 | 5 |
| 14 | 10 |
| 15 | 15 |
| 16 | 20 |
| 17 | 25 |
Both datasets in the table above have an average of value of 15. However, looking at the two datasets, it’s clear that they represent wildly different types of data.
Formula for the Mean Absolute Deviation
Now, let’s dive into how the mean absolute deviation is calculated. You can use the steps below to calculate the MAD:
- Calculate the mean of the dataset
- Calculate the absolute difference between each value and the mean value
- Calculate the average of these differences
When we calculate the mean absolute deviation of our datasets above, we get the following:
- Dataset #1: 1.2
- Dataset #2: 6
We can see that while the two datasets share the same mean, the mean absolute deviation for the second data is six times larger than that of the first.
Now that you have a strong understanding of how the MAD is calculated, let’s dive into how to calculate the mean absolute deviation in Excel.
How to Calculate the Mean Absolute Deviation in Excel
How can you calculate the mean absolute deviation (MAD) in Excel?
To calculate the mean absolute deviation in Excel, you can use the built-in AVEDEV() function. The function accepts numbers or a range of numbers and returns a single value, representing the mean absolute deviation.
While it’d be quite easy to calculate the value manually, having a built-in way makes the behavior less error-prone to typos.
Let’s take a look at the AVEDEV() function in Excel:
AVEDEV(number1, [number2], ...)The function accepts a number or range of numbers as its only required argument. If you’re entering values manually, you can enter up to 255 values. It’s easier to simply add a range of values, which doesn’t have restrictions in terms of the number of values.
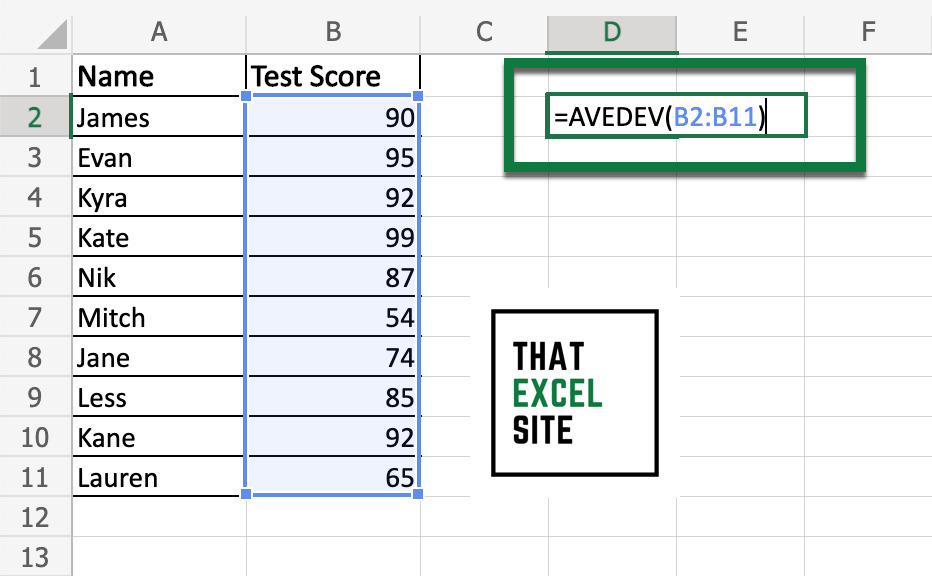
Let’s take a look at an example. We’ll load a dataset that contains text scores for different students. In this case, we want to get a better sense of how to dispersed our dataset is.

We can see that we have our data in two columns: the first contains the students’ names and the second contains the test scores. In another cell, in this case D2, we can enter our formula to calculate the mean absolute deviation: AVEDEV(B2:B11).
Once we hit the Return key, the mean absolute deviation is calculated, as shown below:
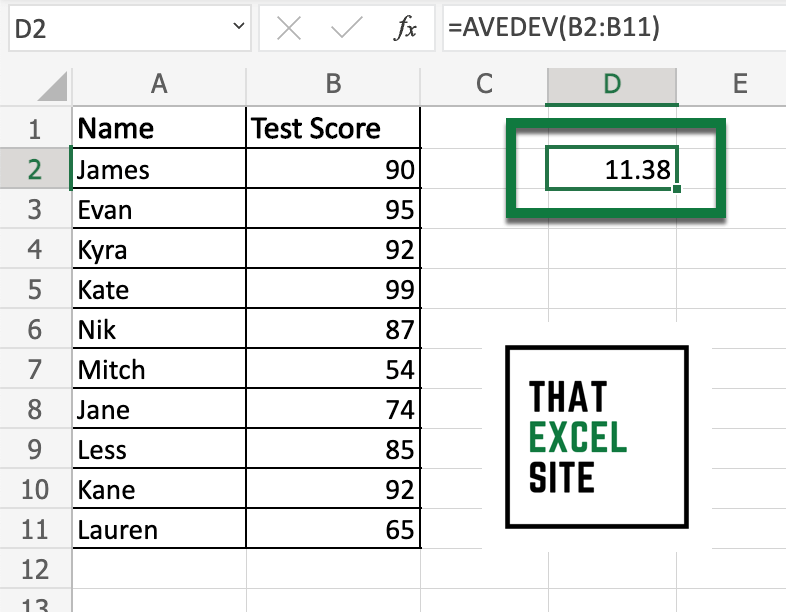
We can see that this returns a mean absolute deviation value of 11.38. This means that, on average, scores are 11.38 away from the mean of the dataset.
Excel AVEDEV() with Text and Logical Values
The Excel AVEDEV() function ignores any values with text or logical values. While other functions may treat these values as either 0 or 1, the AVEDEV() function simply ignores these. It’s important to be aware of this. Depending on how your data is structured, you may need to adjust your data.
How to Interpret the Mean Absolute Deviation
The mean absolute deviation is a measure of dispersion, similar to the standard deviation. This means that it measures how varied your data is. The MAD calculates how far values are, on average, from the mean value of the dataset. You can interpret the mean absolute deviation in the following ways:
- The higher your mean absolute deviation, the larger the dispersion of your dataset
- The lower your mean absolute deviation, the smaller the dispersion of your dataset
Measures of central tendency, like the mean, give us a good sense of where data are centered. Meanwhile, measures of dispersion give you a sense of how varied your data is.
Because the mean absolute deviation uses the absolute difference data points, it’s less prone to outliers than other measures such as the standard deviation. The standard deviation actually squares the difference, meaning that the effect of outliers is amplified. This means that the mean absolute deviation can be a good measure to use if you want the measure to not be amplified by outliers.
Conclusion
In this tutorial, you learned how to calculate the mean absolute deviation (MAD) in Excel. The mean absolute deviation calculates, on average, how far values are dispersed from the average value of a dataset. You first learned how the mean absolute deviation is calculated mathematically. Then, you learned how to use the Excel AVEDEV() function to calculate the mean absolute deviation. Using a built-in function can be a powerful way to ensure that your calculations are less prone to errors due to typos. Finally, you learned how to interpret the mean absolute deviation and how it relates to other measures of dispersion.
Additional Resources
To learn more about related topics, check out the tutorials below: