The root mean squared error (or RMSE) measures how large the error (or difference) is between two datasets. It’s often used to be able to calculate the effectiveness of different types of modeled data, comparing predicted and actual values. In this tutorial, you’ll learn how to calculate the root mean squared error in Excel. While Excel doesn’t have a built-in function to calculate the RMSE, it’s easy to do using other built-in functions.
By the end of this tutorial, you’ll have learned the following:
- How to calculate the root mean squared error in Excel
- What the root mean squared error (RMSE) is
- How to interpret the root mean squared error value
Understanding the Root Mean Squared Error
The root mean squared error (or RMSE) compares the predicted value and the actual value. Because of this, the smaller the error, the more accurate your predicted values are. In some cases, the RMSE is also referred to as the root mean square deviation, since it measures the deviation from a true value.
It’s important to note that the RMSE is different from the mean squared error. However, they are closely related. As the name implies the RMSE is simply the square root of the MSE. Because of this, we can follow similar steps to calculate the RMSE, as we would the MSE.
One of the key benefits of the RMSE is that it uses the same units as the original dataset. Because it’s the square root of the squared error, it’s also less prone to being affected by outliers, when compared to the MSE.
The formula below demonstrates how the root mean squared error is calculated:

While this may look complicated, it’s actually quite simple. Let’s break down what this calculation means:
- Calculate the difference between the true and predicted value for every observation
- Square the calculated differences
- Sum up all of these differences
- Divide the sum of squares by the number of observations in the dataset
- Take the square root of the returned value
If you’re familiar with the mean squared error, you may actually note that the first four steps are the exact same! Now that you have a strong understanding of how to calculate the RMSE, let’s see how to do this in Excel.
How to Calculate the Root Mean Squared Error in Excel
Below, you’ll find a simple guide to calculating the root mean squared error in Excel. Let’s begin by loading a sample dataset that has values for both observed values and predicted values. We can see that the dataset is quite simple. However, the process works for a dataset of any size!
How to Calculate the Root Mean Squared Error in Excel
Load your observed and true values into columns
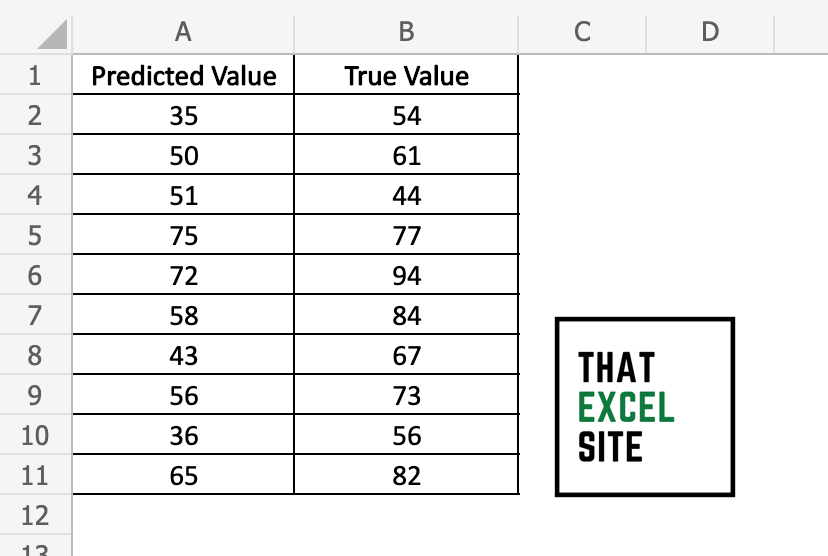
We can see that we have two columns of data. In column A, we have our observed values. In column B, we have our true values.
Calculate the difference between the observed and squared values
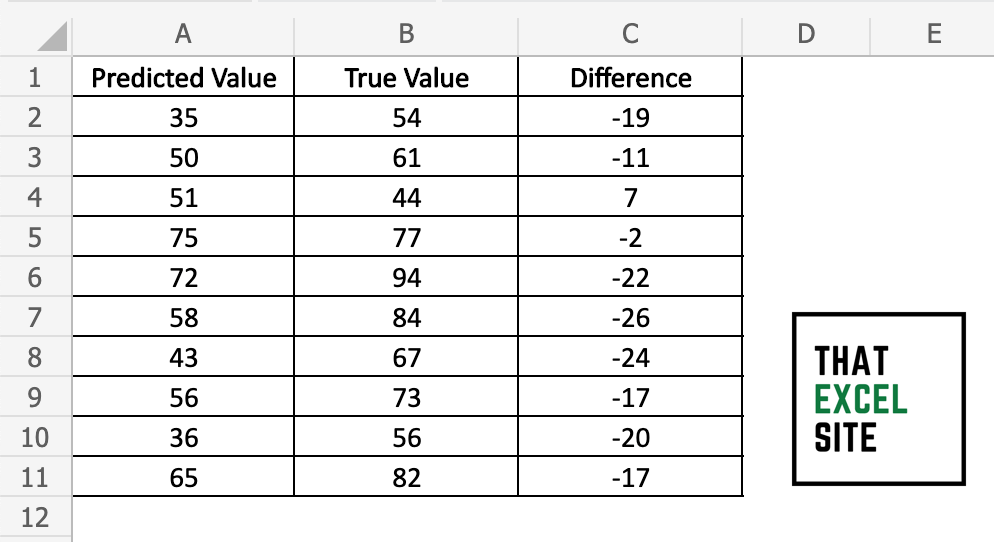
Subtract the values in column B from those in column A. For example, your formula in cell C2 will be =B2-A2. Drag the fill handle down to the end of your dataset to complete the formula for all observations.
Calculate Sum of Squares Using SUMSQ()
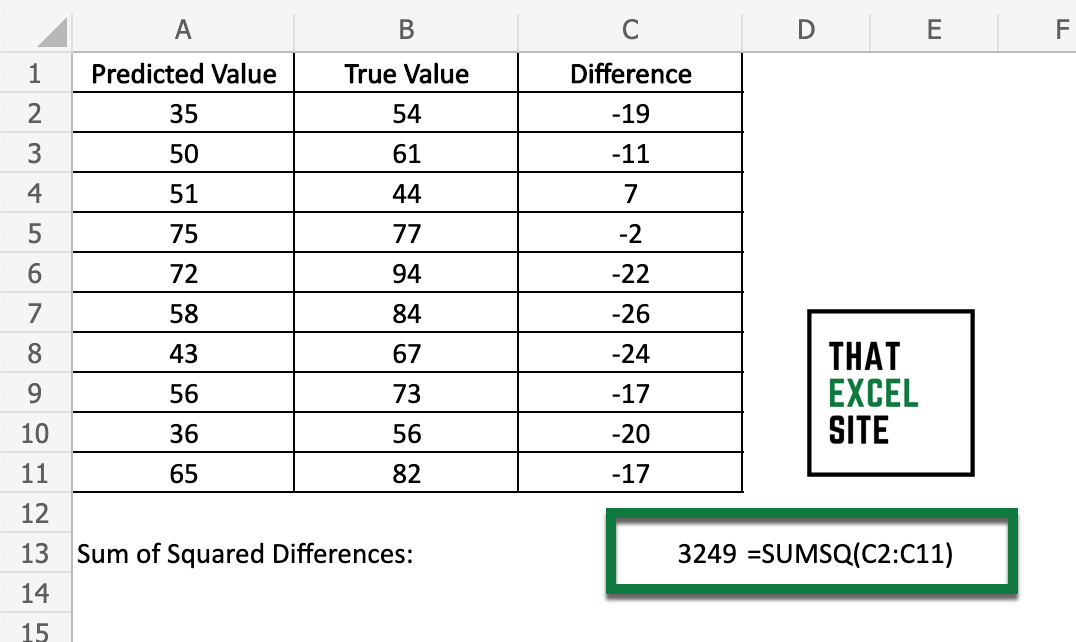
In order to add up the sum of squares, you can make use of the Excel SUMSQ() function. The function adds up the squared values in the range that you pass into it. Similarly, you could add a new column that calculates the squared value using the carat operator. Then, to calculate the sum, simply pass the values into the SUM() function.
Take the average of the sum of squares
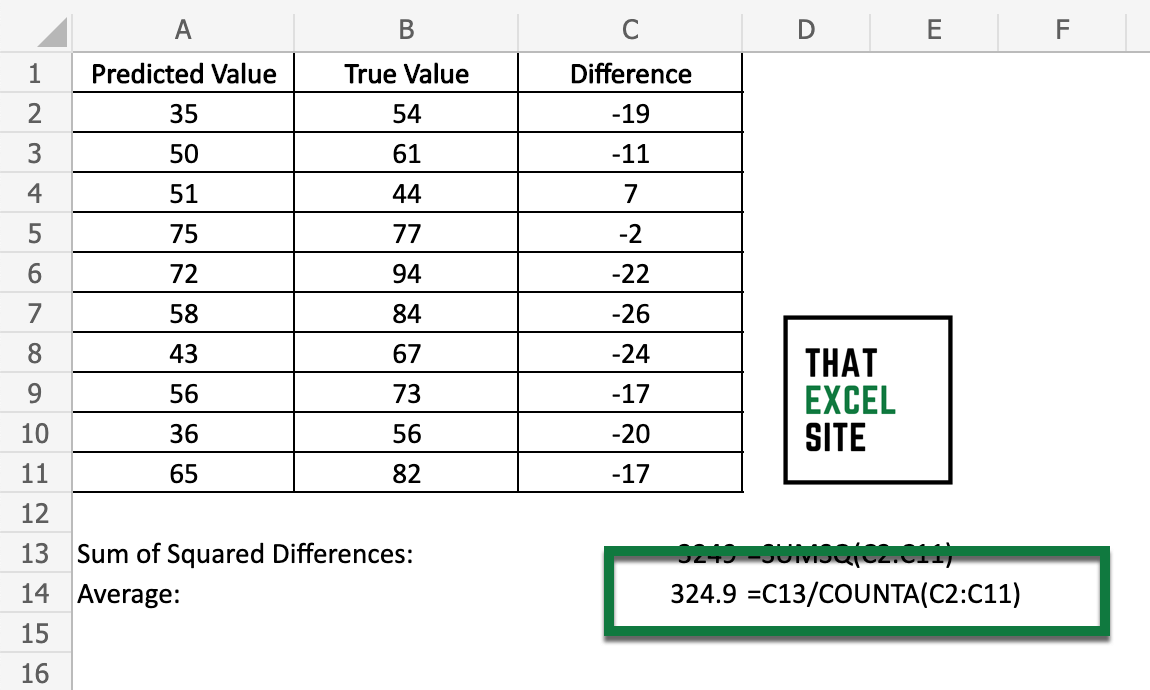
To take the average value, simply divide the sum of squares by the number of observations in your dataset. For this, you can use the COUNTA() function, which counts all of the non-missing values in that column.
Take the square root of the average value using SQRT()
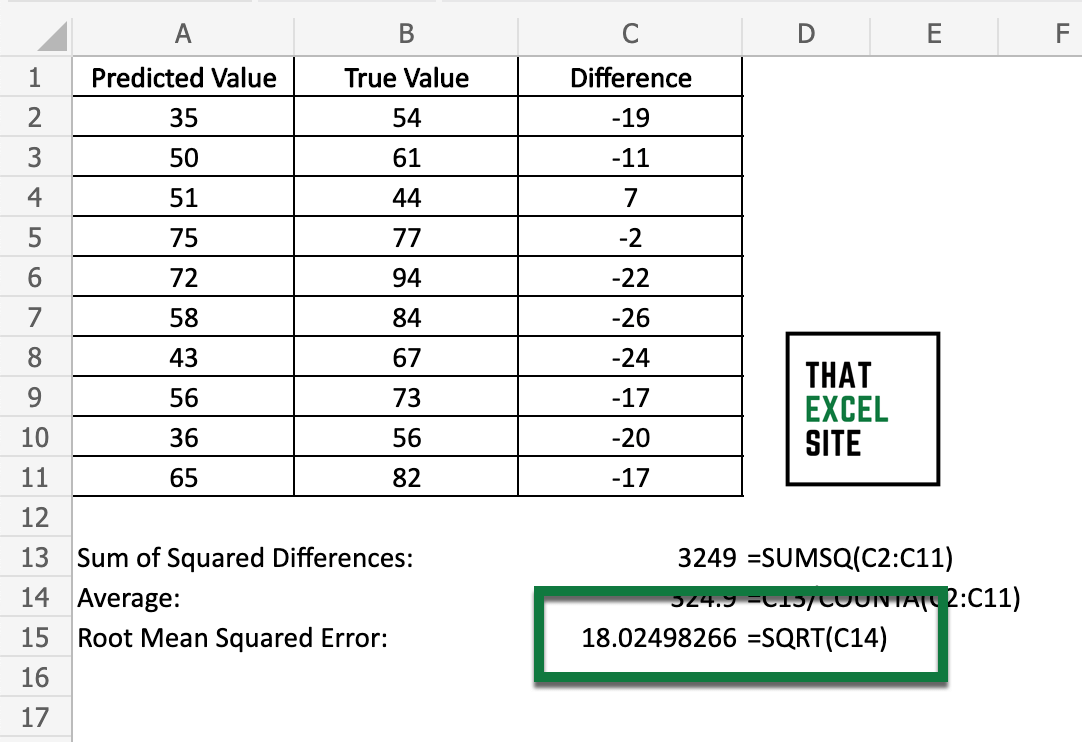
Finally, take the square root of the average value. In order to calculate the square root of a value in Excel, you can use the SQRT() function. When you hit the Return key, the RMSE will be returned.
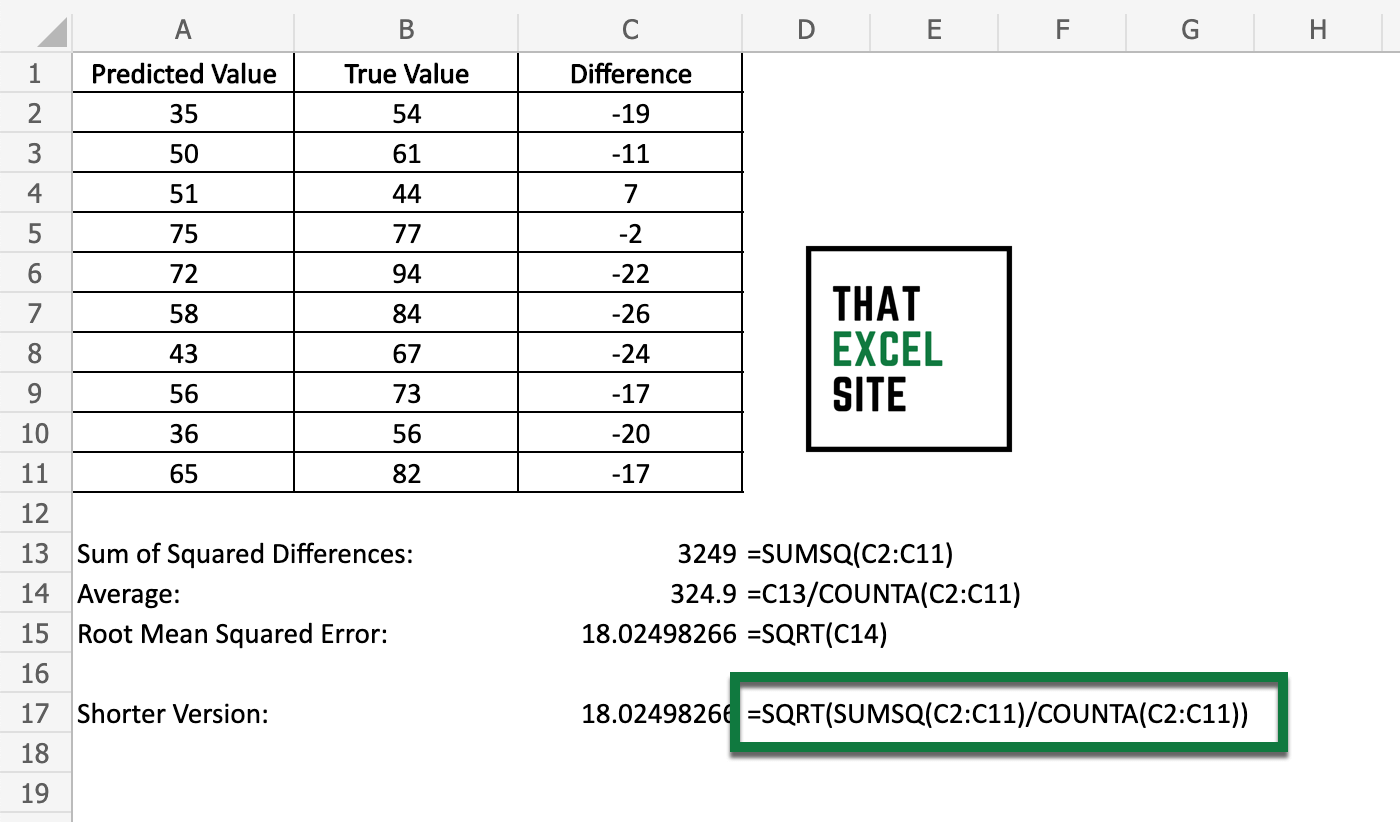
That wasn’t so bad, was it? While Excel doesn’t provide a built-in way of calculating the RMSE, it’s made quite easy by using other built-in functions, such as the square root function. In fact, once you have the column of differences calculated, you can abbreviate everything to one function, as shown below:
=SQRT(SUMSQ(C2:C11) / COUNTA(C2:C11))Now that you know how to calculate the root mean squared error in Excel, let’s take a look at how you can interpret the result.
How to Interpret the Root Mean Squared Error
Earlier in the tutorial, you learned that a root mean squared error that is smaller is considered better. However, there is no “target” value for an RMSE. Of course, a root mean squared error value of 0 means that your model is predicting perfectly.
That said, an RMSE value of 1 may be great for one set of data and terrible for another. This comes down to the type of data you’re working with. For example, your threshold for acceptable error in some fields will be lower, compared to others.
It’s important to note that the root mean squared error will always be 0 or a positive value. Since the unit of the error actually matches that of the original dataset, you can easily communicate the RMSE. This is a big benefit of the RMSE when compared to the mean squared error. In the MSE, the error is actually communicated in the square of the original unit.
Conclusion
In this tutorial, you learned how to calculate the root mean squared error in Excel. The root mean squared error, often referred to as the root mean squared deviation, is a measure of how close your observed values are to their predicted values. Because of this, the measure is often used to compare two different predictive models for their effectiveness.
You first learned more about the root mean squared error and how it’s calculated mathematically. Then, you learned how to calculate the root mean squared error in Excel. Despite Excel not having a built-in function for calculating the error, the process is made simple using other built-in functions. Finally, you learned how to interpret the RMSE value and when you may want to use it over the mean squared error.
Additional Resources
To learn more about related topics, check out the tutorials below: