
In this post, you’ll learn how to count unique occurrences in Excel. Being able to count unique occurrences allows you to count how often each value occurs in a given range of data. This can be very helpful in order to be able to understand how often different data occur. For example, you may want to count how often a user logged into an application. Similarly, you may want to know how many classes a student has taken. In order to do this, we’ll use the Excel COUNTIF() function.
By the end of this tutorial, you’ll have learned the following:
- How to count unique occurrences in Excel by using the COUNTIF() function
- How to get unique values using an Excel formula, UNIQUE(), to count occurrences
Count Unique Occurrences in Excel
You can count how often an item occurs in a range of values, you can use the COUNTIF() function like this: =COUNTIF(range, value). In order to get the unique values in a list of values, you can use the UNIQUE() function to get a list of all unique values in a range of values.
Let’s take a closer look at these two functions:
- The Excel UNIQUE() function returns an array of all of the unique values in a range of values,
- The Excel COUNTIF() function is used to count values in a range of values that meet a certain condition.
Let’s see how we can use these two functions to count unique occurrences in Excel by using a step-by-step example. We’ll load a dataset and count how often each unique value occurs in a range of values.
How to Count Unique Occurrences in a Range of Values in Excel
Load your dataset in Excel
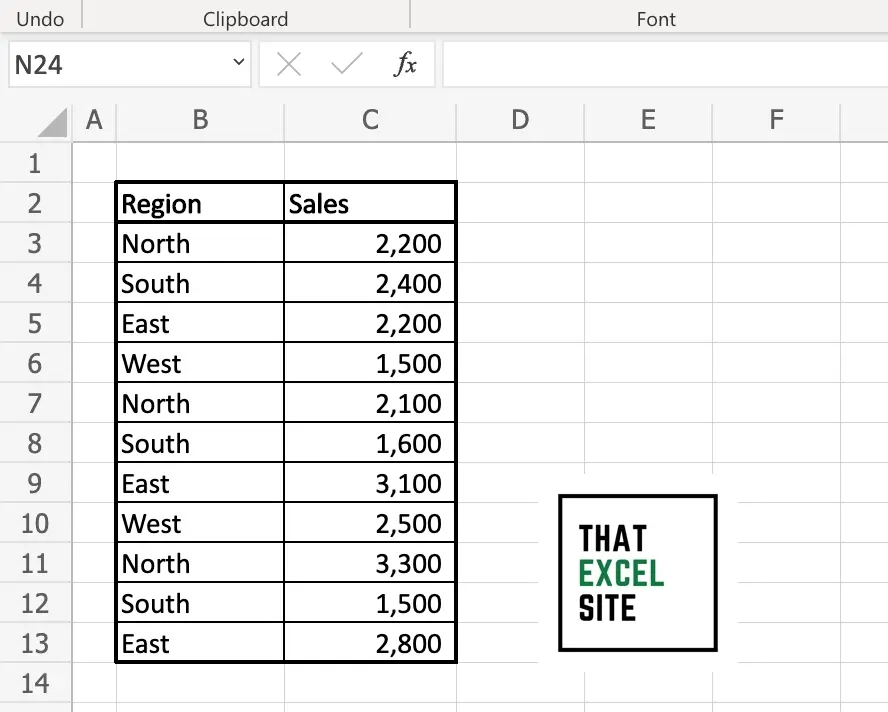
Let’s start by loading the dataset that we’re using for this tutorial. We’re using a dataset that covers regional sales data. Each record in the dataset covers both the region in which a sale was made and the value of the sale. We want to count how often each region occurs in the dataset.
Get the unique values in a range of data
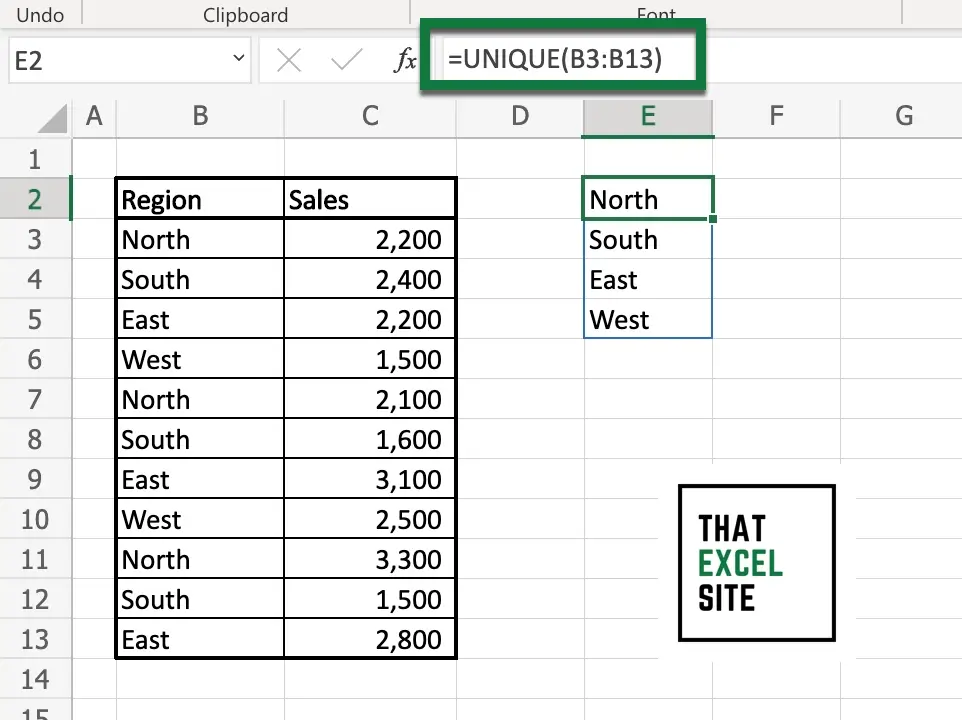
We can use the UNIQUE() function to extract the unique values in the range B3 to B13. When we enter the UNIQUE() function into the cell, it takes up as much space as it needs to get the unique values in the range of data. Notice the blue border around the cell? This is a dynamic array, where cells “spill” into the cells below.
Use COUNTIF() to count how often something occurs
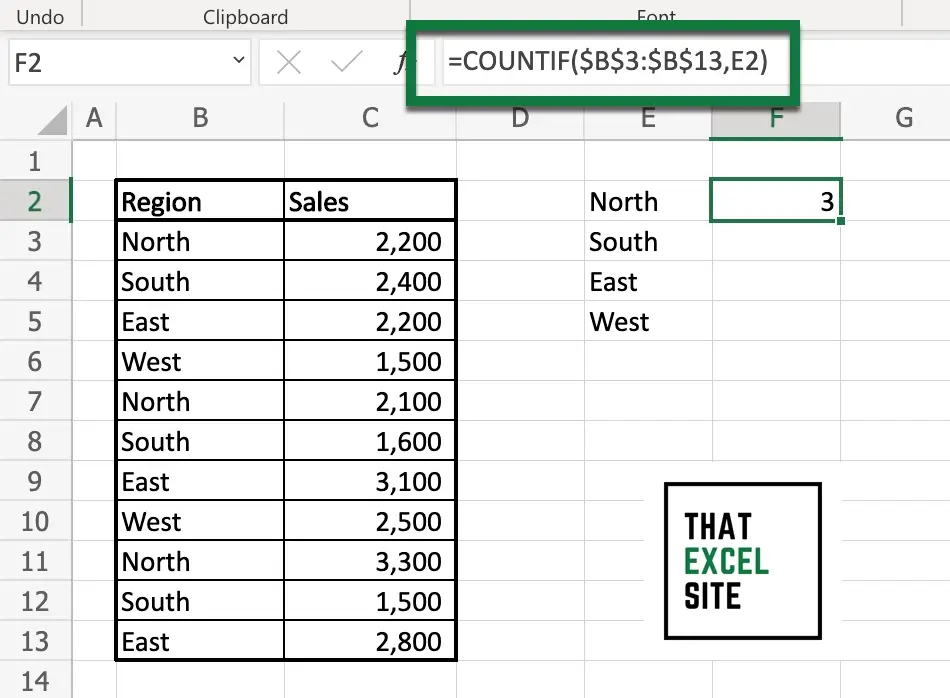
Use the COUNTIF() function to count the number of times a cell’s value occurs in a range of values. We’re using the formula: =COUNTIF($B$3:$B$13,E2). In this formula, we’re asking Excel to count in the range of B3:B13, though we’re using absolute references. This allows us to copy and paste the formula for different criteria, without needing to modify the range. As the criteria, we’re using the value in cell E2, which represents North. This counts how often North occurs in the range of values, which in this case is 3.
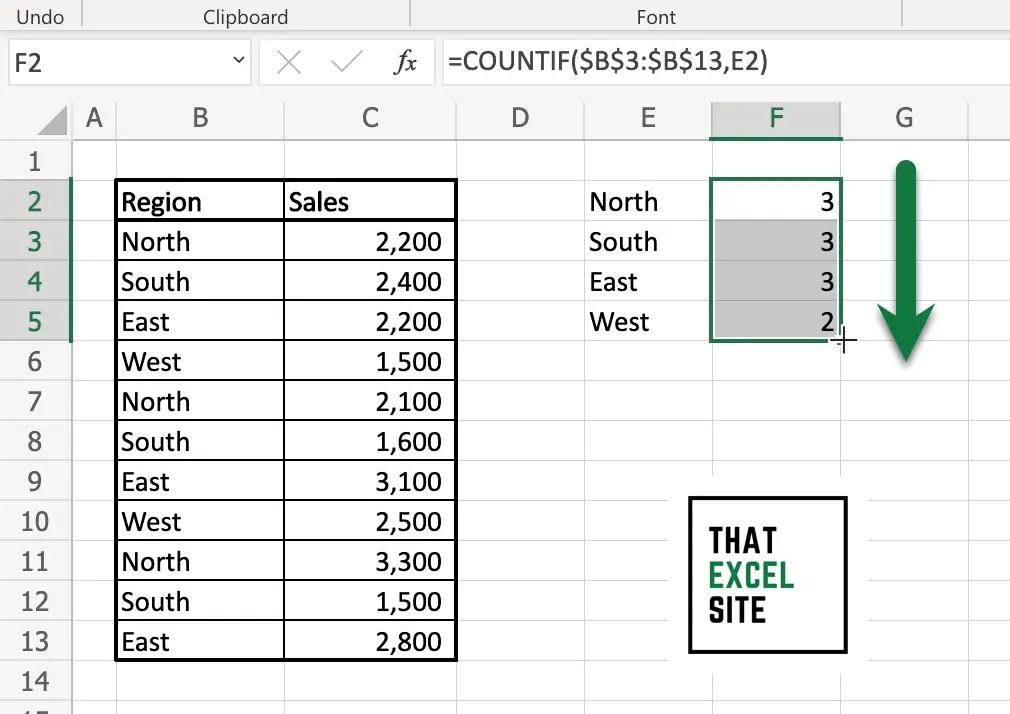
Drag the fill handle to count occurrences for each unique value
In order to count all unique occurrences in Excel, we can click and drag the fill handle down to the end of the range. The fill handle is the little crosshairs that occur when you hover over over the bottom right of a cell. By clicking and dragging this all the way down, the formula copies down. Since we’re using absolute references, Excel can safely copy the formula across all values in the range.
In the example above, you learned how to count the unique occurrences in Excel. You combined the Excel UNIQUE() function with the COUNTIF() function to count how often each unique value occurs in an Excel range.
Conclusion
In this tutorial, you learned how to count the number of unique occurrences in Excel. This opens up a ton of possibilities for you to work more efficiently in Excel. For example, you can count how many classes a student has taken by looking at a class register. Similarly, you could count how often a user has accessed a program by looking at audit logs.
You learned how to do this using the Excel UNIQUE() function and the Excel COUNTIF() function. The Excel UNIQUE() function creates a spill-over array of unique values in a list of values. The COUNTIF() function can then be used to count how often each unique value occurs in a range of data. By combining these two functions, you’re able to easily count the number of unique occurrences in an Excel worksheet.
Additional Resources
To learn more about related topics, check out the resources below: