In many industries, being able to forecast values is a necessary skillset to have. In order to measure the effectiveness of predictions, it’s essential to compare the predicted values to the actual, observed values. One of the measures that make measuring the effectiveness of a predictive model simple, is the mean absolute error (or MAE). In this tutorial, you’ll learn how to calculate the mean absolute error in Excel.
By the end of this tutorial, you’ll have learned the following:
- How to calculate the mean absolute error in Excel
- How the mean absolute error is calculated
- How to interpret the mean absolute error for a given model
Understanding the Mean Absolute Error (MAE)
The mean absolute error describes how far, on average, the model’s predicted values are away from the observed values. Because the mean absolute error calculates the absolute difference, the MAE doesn’t factor in whether a prediction was too high or too low.
The mean absolute error is closely related to the mean absolute percentage error. However, rather than returning a percentage value, the mean absolute error returns a value that matches the unit of the observations.
Let’s take a look at the formula for the mean absolute error:

In order to calculate the mean absolute error, you can simply follow the steps below:
- Calculate the difference between the actual and observed value for each record
- Calculate the absolute value of this difference
- Calculate the average of these values
While the formula may look complicated, the actual process is quite simple! In the following section, let’s dive into how to calculate the mean absolute error in Excel.
How to Calculate the Mean Absolute Error in Excel
In the section above, you learned how to calculate the mean absolute error from a theoretical standpoint. Let’s now dive into how to calculate the mean absolute error in Excel. We’ll load a sample dataset that contains 10 different data points, including predicted and actual values.
The steps below show a simple process of calculating the mean absolute error in Excel:
How to calculate the mean absolute error (MAE) in Excel
Load a dataset containing observed and predicted values in two separate Excel columns
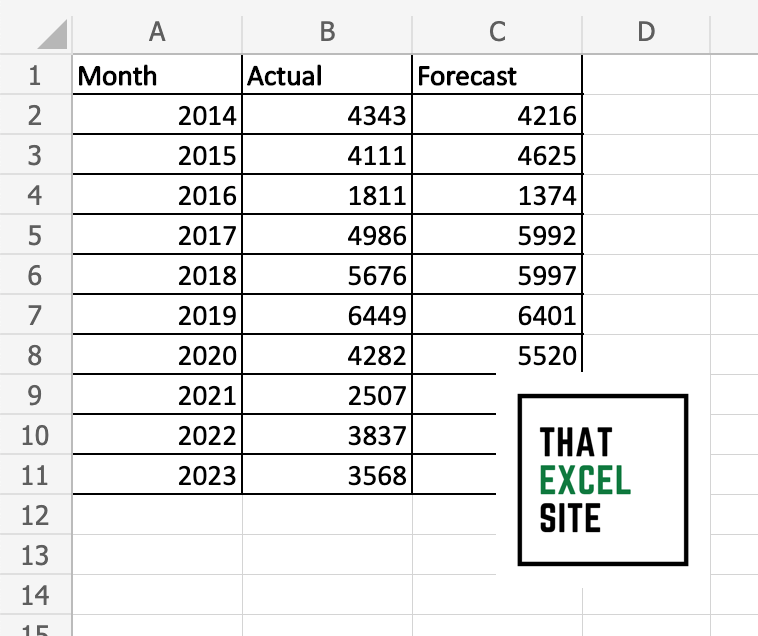
In the dataset above, we loaded a dataset that contains fictional data. The data has ten records and contains actual and observed values for each data point. The dataset may actually look familiar to you – it’s the same we used in learning how to calculate the mean absolute percentage error (MAPE) in Excel.
Calculate the Absolute Difference Between the Actual and Observed Value
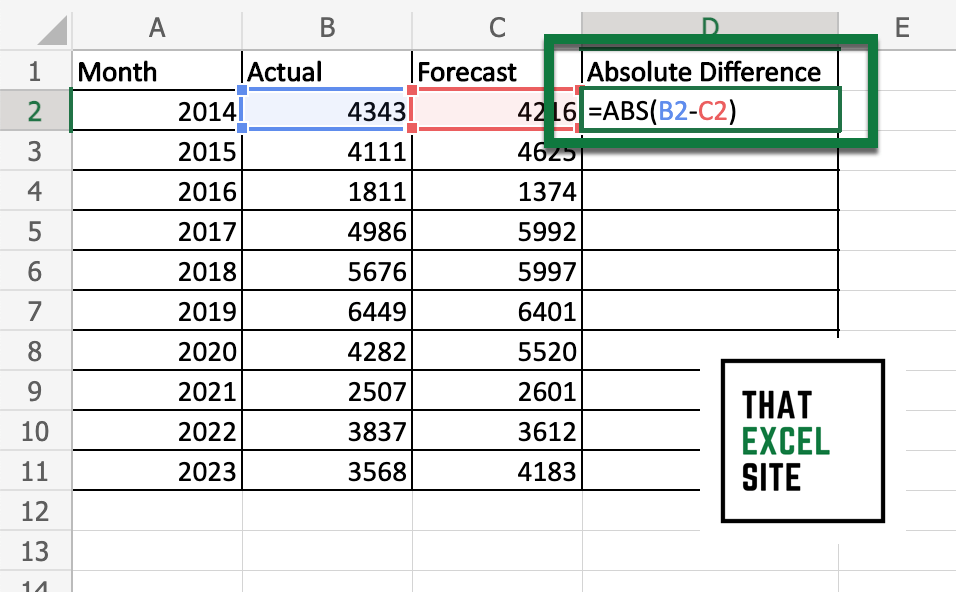
In cell D2, we entered the following formula =ABS(B2-C2). This calculates the absolute difference between the actual and observed value. Because we’re calculating the absolute value, it doesn’t matter in which order you subtract the values.
Drag the Fill Handle to Calculate the Absolute Difference for Each Record
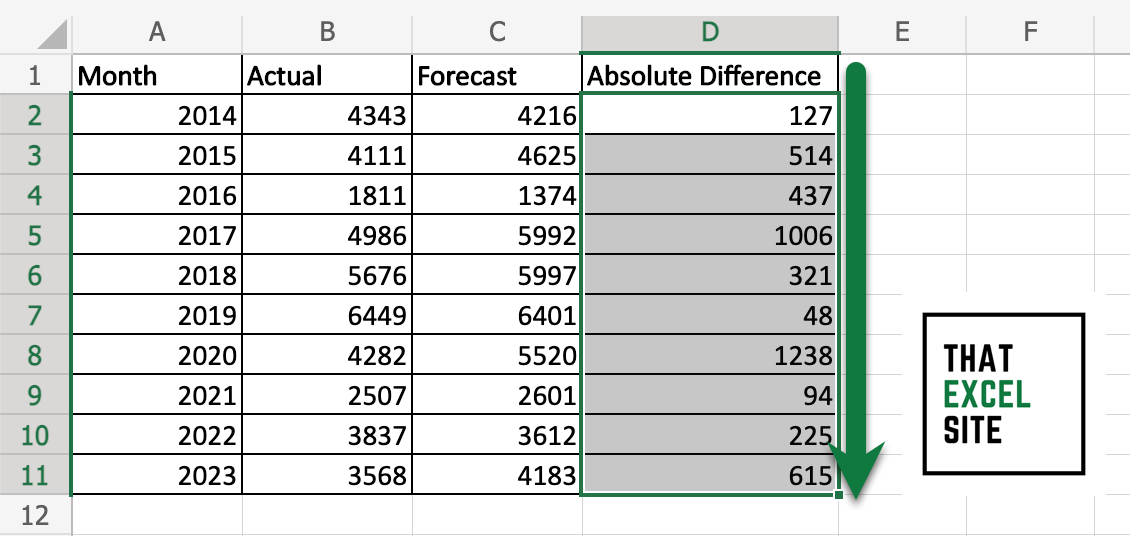
Click on the fill handle on cell D2 and drag it down through to the end of your dataset. This will calculate the absolute difference for each record in your dataset, without needing to manually type the formula.
Calculate the Average Value of the Absolute Difference to Calculate the MAE

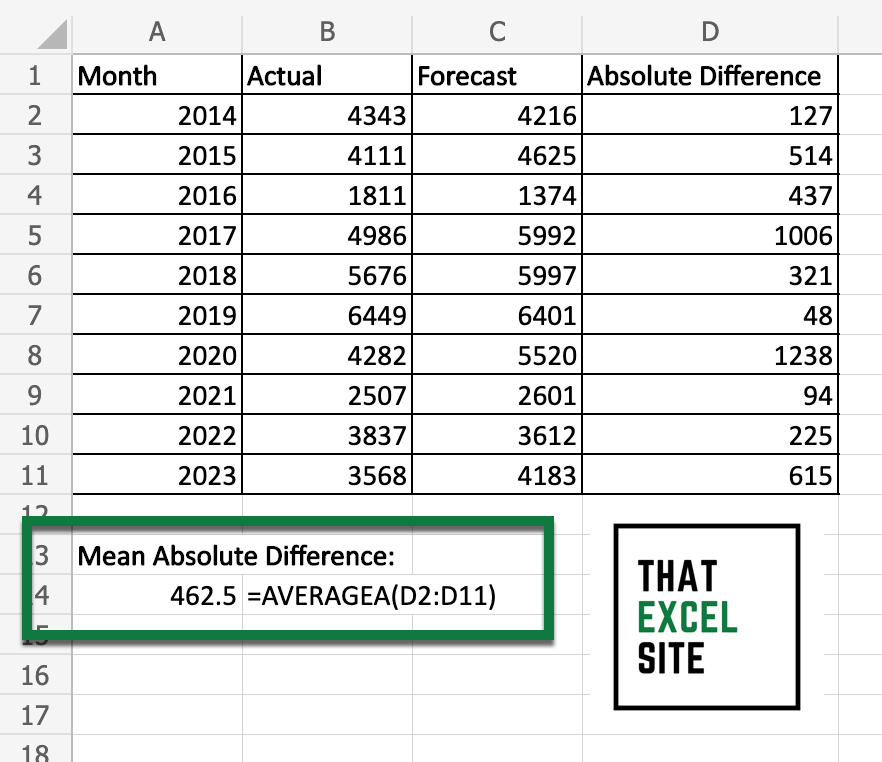
Using the AVERAGEA() function, we can calculate the mean absolute error in Excel. The AVERAGEA() function calculates the average value and includes logical and text values.
See – that wasn’t too bad! While there is no built-in way to calculate the mean absolute error in Excel, using other built-in functions it’s quite simple! In the following section, you’ll learn how to interpret the mean absolute error.
How to Interpret the Mean Absolute Error
The mean absolute error tells you how far, on average, your predicted values are from their actual values. The error statistic is quite similar to other error metrics, such as the mean squared error or the root mean squared error, but provides you with a different lens on how to interpret the error.
Similar to other error metrics, the closer the value of the mean absolute error is to zero, the better. It’s important to note, however, that there is no specific standard as to what makes a good mean absolute error. Because the tolerance for error differs from industry to industry, it’s important to use the context of your dataset to interpret whether a mean absolute error is good or bad.
It can be helpful to calculate both the mean absolute error and the mean absolute percentage error. The mean absolute percentage error abstracts away the units but can be easily swayed by small value ranges. Meanwhile, the mean absolute error may make it difficult to infer how large an error is relative to the other values in the dataset.
Conclusion
In this tutorial, you learned ow to use Excel to calculate the mean absolute error, or MAE. The MAE is an important error statistic, used to let you know how close your predicted values were to the actual, observed values in a dataset. In many industries, forecasting is an important skillset. Being able to create forecasting models means needing ways in which you can evaluate their performance. In many cases, this performance is related to seeing how close predicted values are to their actual values.
You first learned how the mean absolute error is calculated mathematically. We explored how to do this in plain-English, giving you a strong foundation in being able to use Excel for this. While Excel doesn’t provide a built-in function to calculate the mean absolute error, it’s made simple by using functions such as the ABS() function and the AVERAGEA() function. Finally, you learned how to interpret the mean absolute error and how it relates to other error statistics.
Additional Resources
To learn more about related topics, check out the tutorials below:

